Dynamic dependence networks: Financial time series forecasting and portfolio decisions (with discussion)
Publication
Metrics
AI Quick Summary
This paper introduces Bayesian forecasting models for high-dimensional financial time series, employing dynamic dependence networks to characterize sparse interdependencies among multiple series. The decoupling and recoupling approach facilitates efficient univariate analysis and improved forecasting for portfolio decisions, demonstrated through a detailed case study involving international currency, stock indices, and commodities.
Paper Preview
Abstract
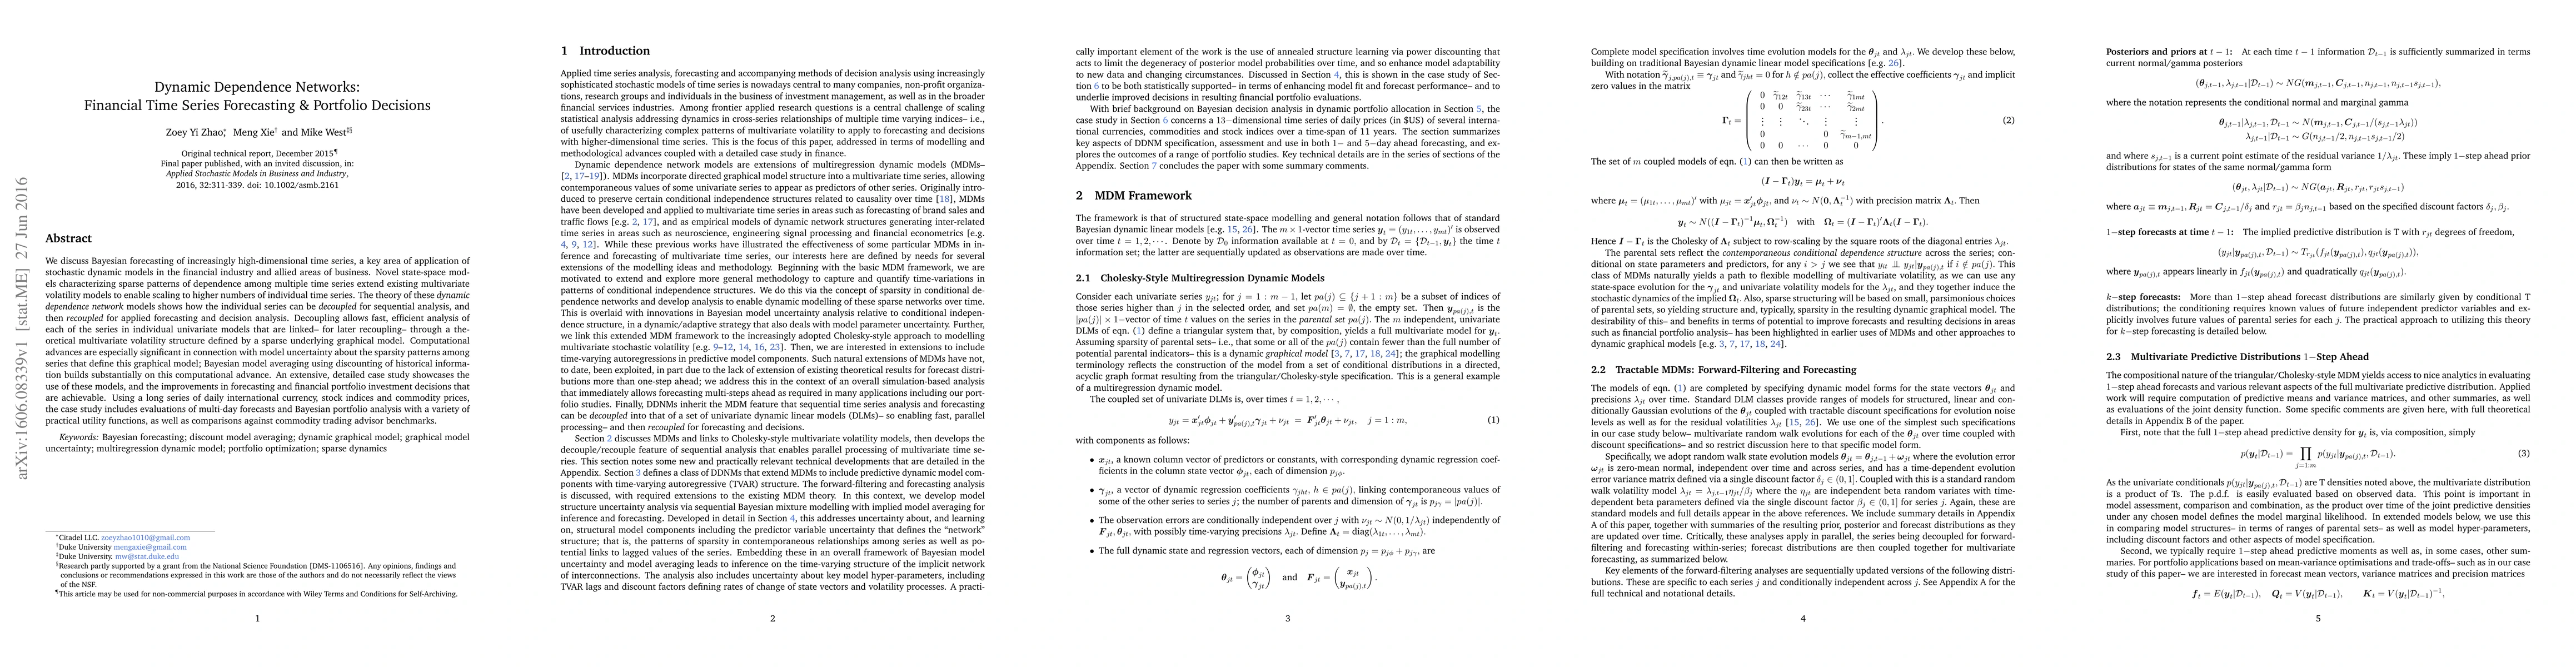
We discuss Bayesian forecasting of increasingly high-dimensional time series, a key area of application of stochastic dynamic models in the financial industry and allied areas of business. Novel state-space models characterizing sparse patterns of dependence among multiple time series extend existing multivariate volatility models to enable scaling to higher numbers of individual time series. The theory of these "dynamic dependence network" models shows how the individual series can be "decoupled" for sequential analysis, and then "recoupled" for applied forecasting and decision analysis. Decoupling allows fast, efficient analysis of each of the series in individual univariate models that are linked-- for later recoupling-- through a theoretical multivariate volatility structure defined by a sparse underlying graphical model. Computational advances are especially significant in connection with model uncertainty about the sparsity patterns among series that define this graphical model; Bayesian model averaging using discounting of historical information builds substantially on this computational advance. An extensive, detailed case study showcases the use of these models, and the improvements in forecasting and financial portfolio investment decisions that are achievable. Using a long series of daily international currency, stock indices and commodity prices, the case study includes evaluations of multi-day forecasts and Bayesian portfolio analysis with a variety of practical utility functions, as well as comparisons against commodity trading advisor benchmarks.
AI Key Findings
Get AI-generated insights about this paper's methodology, results, significance, and more — seven facets brought into focus.
Impact
Paper Details
Authors
PDF Preview
Key Terms
Citation Network
Current paper (gray), citations (green), references (blue)
Display is limited for performance on very large graphs.
Discussion 0