Dynamical Analysis of Stock Market Instability by Cross-correlation Matrix
Publication
Metrics
AI Quick Summary
This paper analyzes stock market instability using cross-correlations from 366 Tokyo Stock Exchange stocks from 1998 to 2013. It identifies volatile market stages via principal components analysis and detects significant risks linked to the Lehman Brothers bankruptcy, the 2011 Tohoku earthquake, and the FRB QE3 reduction.
Paper Preview
Abstract
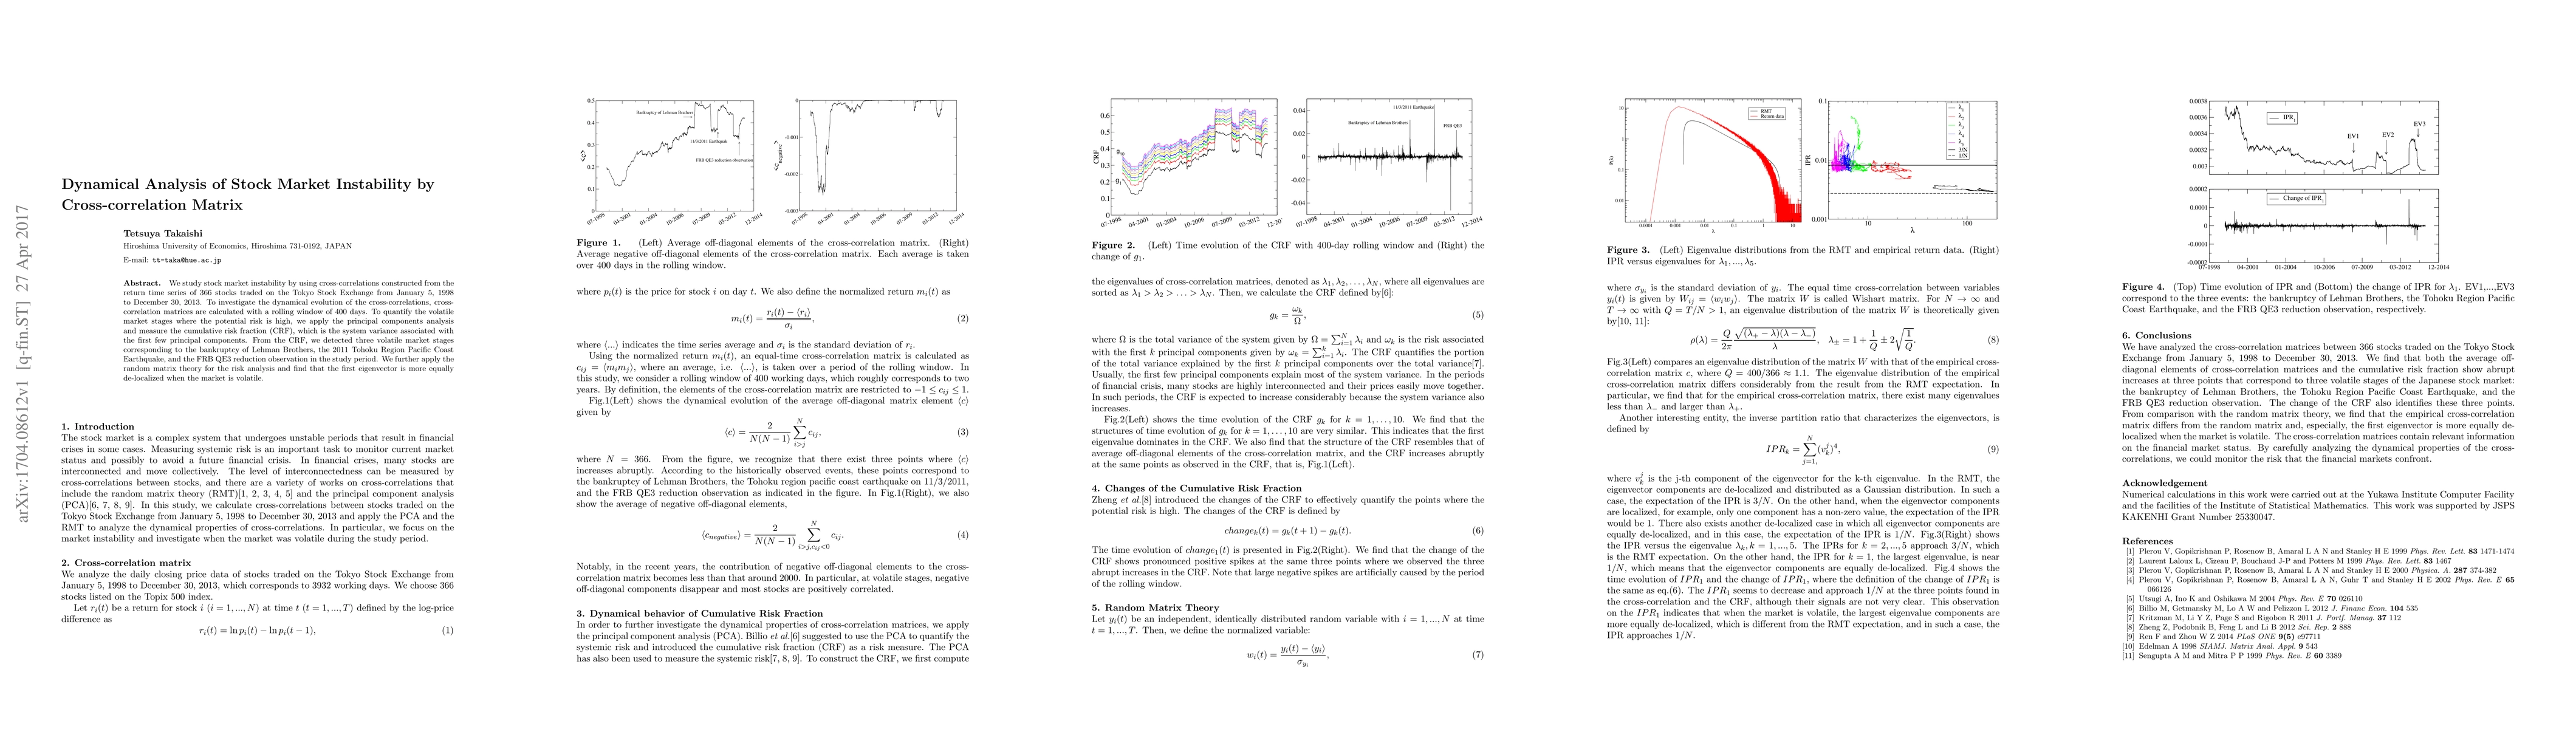
We study stock market instability by using cross-correlations constructed from the return time series of 366 stocks traded on the Tokyo Stock Exchange from January 5, 1998 to December 30, 2013. To investigate the dynamical evolution of the cross-correlations, cross-correlation matrices are calculated with a rolling window of 400 days. To quantify the volatile market stages where the potential risk is high, we apply the principal components analysis and measure the cumulative risk fraction (CRF), which is the system variance associated with the first few principal components. From the CRF, we detected three volatile market stages corresponding to the bankruptcy of Lehman Brothers, the 2011 Tohoku Region Pacific Coast Earthquake, and the FRB QE3 reduction observation in the study period. We further apply the random matrix theory for the risk analysis and find that the first eigenvector is more equally de-localized when the market is volatile.
AI Key Findings
Get AI-generated insights about this paper's methodology, results, significance, and more — seven facets brought into focus.
Impact
Paper Details
PDF Preview
Key Terms
Citation Network
Current paper (gray), citations (green), references (blue)
Display is limited for performance on very large graphs.
Discussion 0