Summary
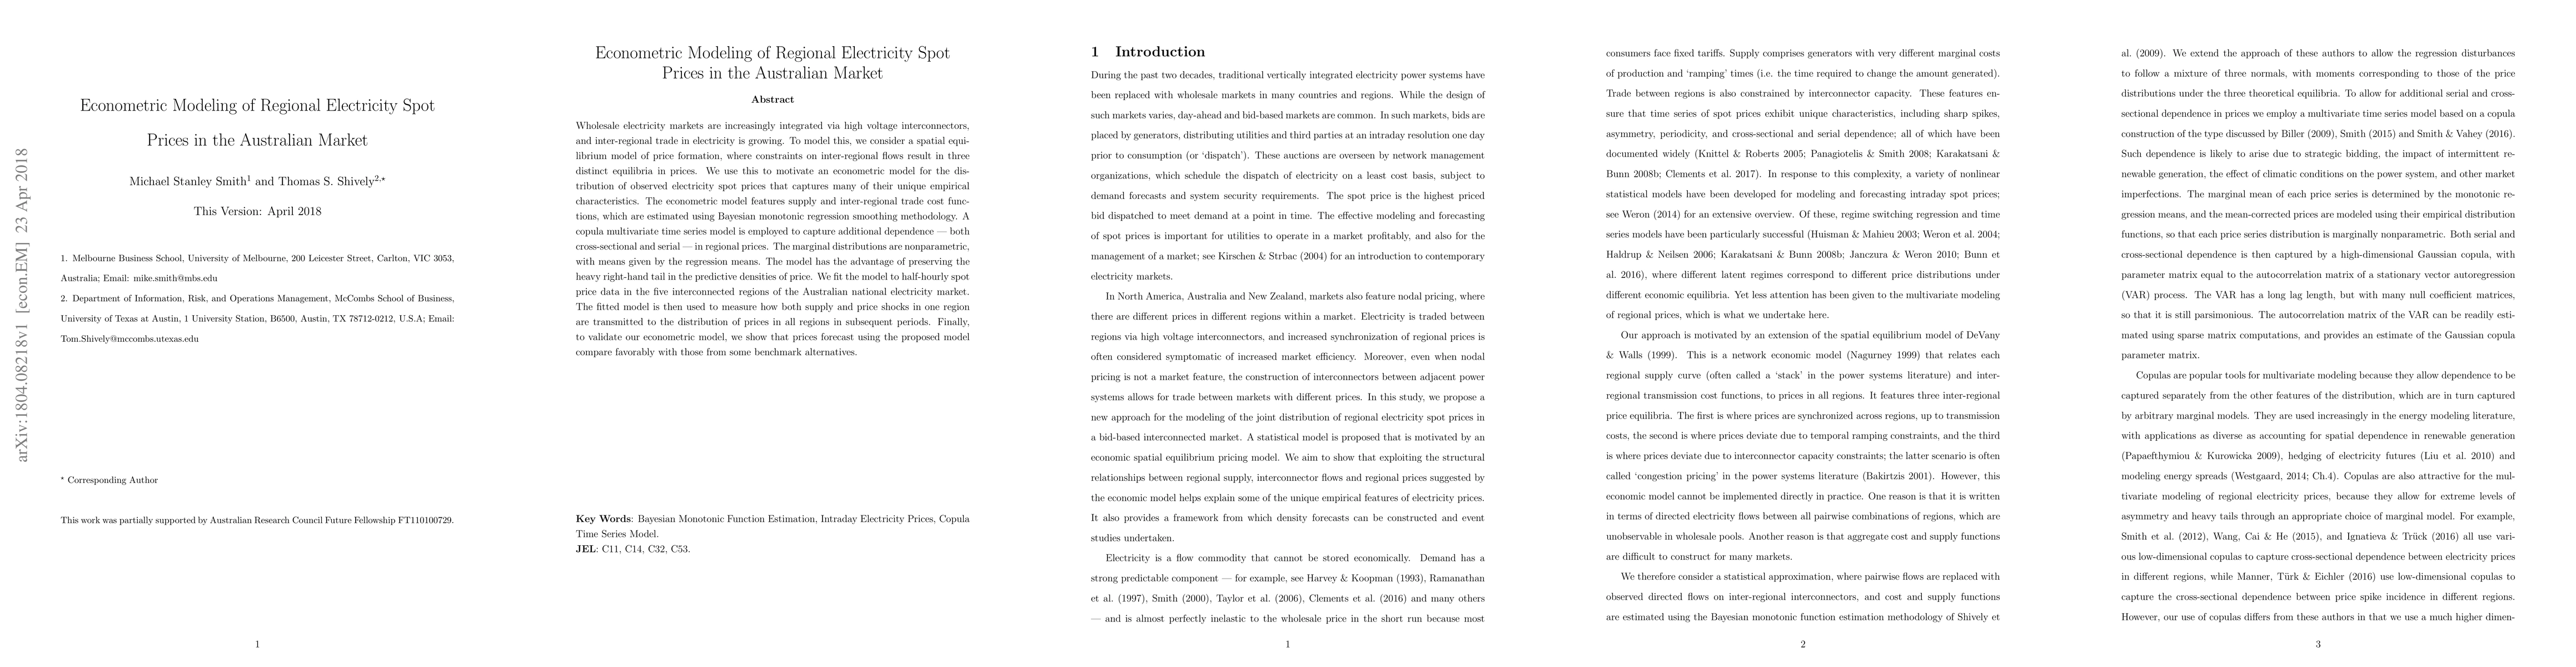
Wholesale electricity markets are increasingly integrated via high voltage interconnectors, and inter-regional trade in electricity is growing. To model this, we consider a spatial equilibrium model of price formation, where constraints on inter-regional flows result in three distinct equilibria in prices. We use this to motivate an econometric model for the distribution of observed electricity spot prices that captures many of their unique empirical characteristics. The econometric model features supply and inter-regional trade cost functions, which are estimated using Bayesian monotonic regression smoothing methodology. A copula multivariate time series model is employed to capture additional dependence -- both cross-sectional and serial-- in regional prices. The marginal distributions are nonparametric, with means given by the regression means. The model has the advantage of preserving the heavy right-hand tail in the predictive densities of price. We fit the model to half-hourly spot price data in the five interconnected regions of the Australian national electricity market. The fitted model is then used to measure how both supply and price shocks in one region are transmitted to the distribution of prices in all regions in subsequent periods. Finally, to validate our econometric model, we show that prices forecast using the proposed model compare favorably with those from some benchmark alternatives.
AI Key Findings
Get AI-generated insights about this paper's methodology, results, and significance.
Paper Details
PDF Preview
Key Terms
Citation Network
Current paper (gray), citations (green), references (blue)
Display is limited for performance on very large graphs.
Similar Papers
Found 4 papersEconometric Modeling of Intraday Electricity Market Price with Inadequate Historical Data
Mohammad Reza Hesamzadeh, Saeed Mohammadi
| Title | Authors | Year | Actions |
|---|
Comments (0)