Summary
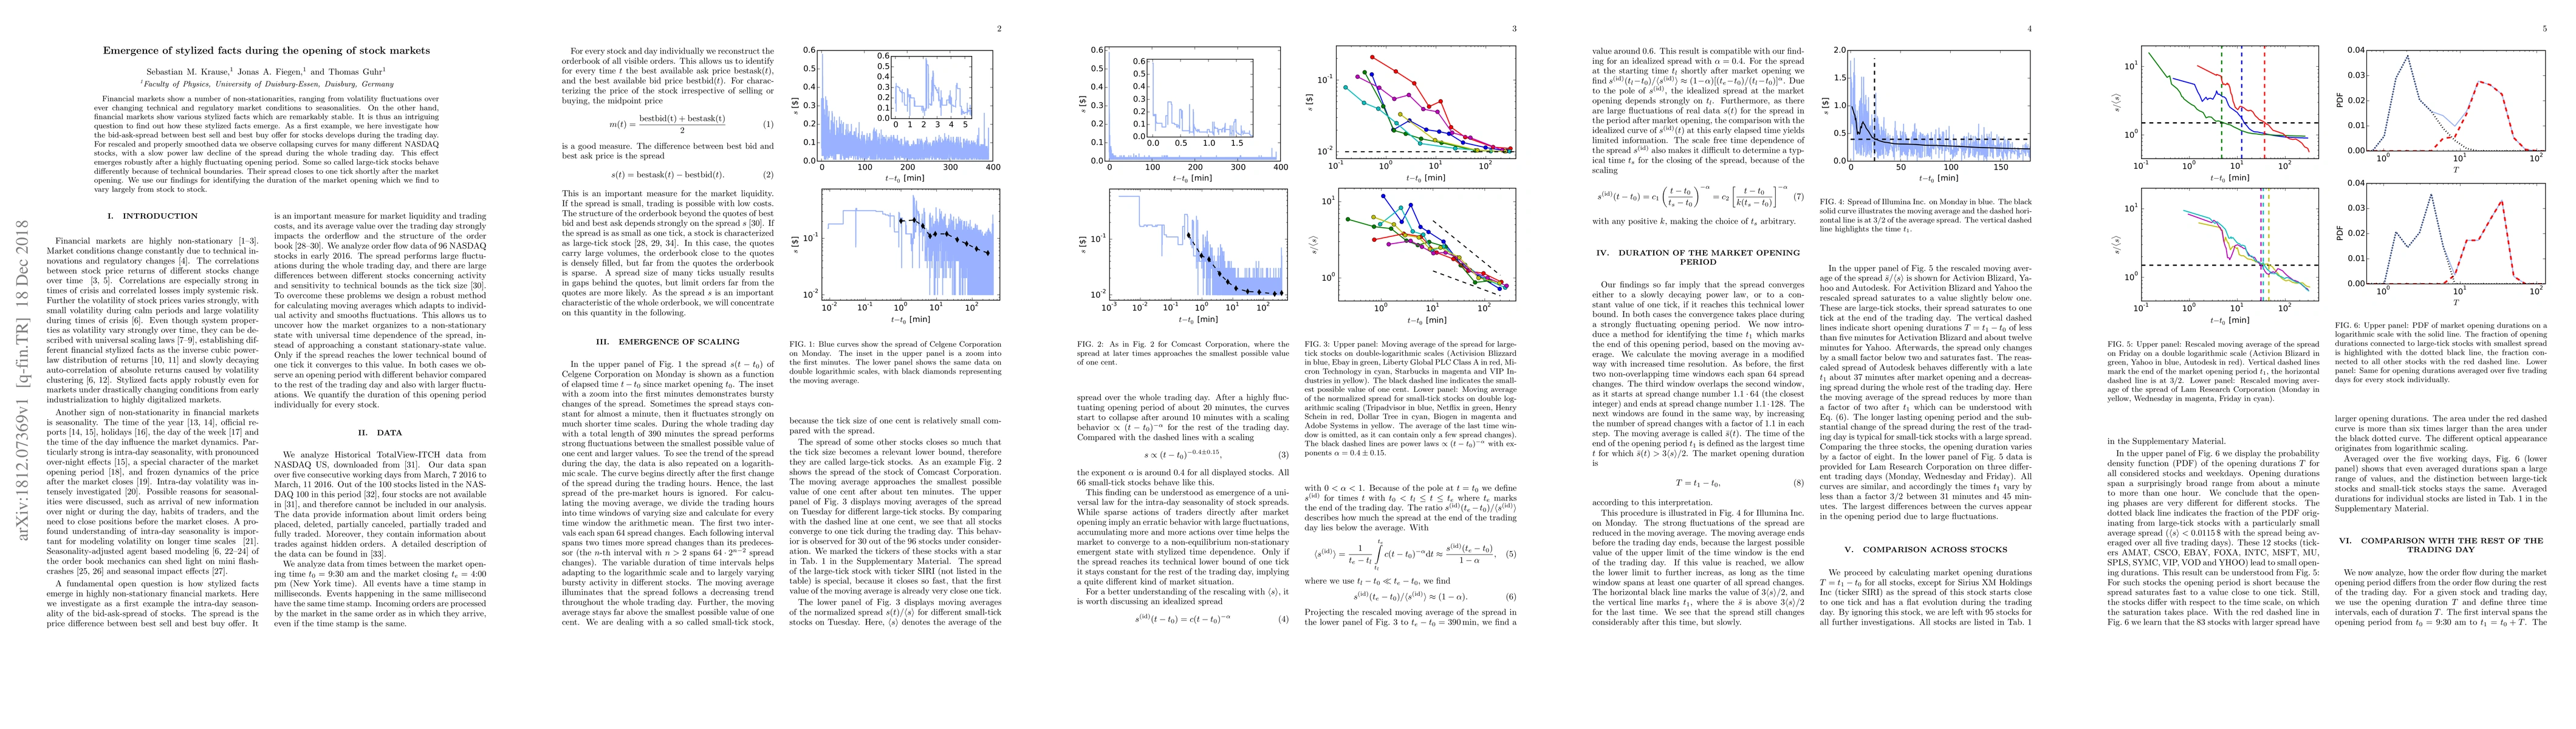
Financial markets show a number of non-stationarities, ranging from volatility fluctuations over ever changing technical and regulatory market conditions to seasonalities. On the other hand, financial markets show various stylized facts which are remarkably stable. It is thus an intriguing question to find out how these stylized facts emerge. As a first example, we here investigate how the bid-ask-spread between best sell and best buy offer for stocks develops during the trading day. For rescaled and properly smoothed data we observe collapsing curves for many different NASDAQ stocks, with a slow power law decline of the spread during the whole trading day. This effect emerges robustly after a highly fluctuating opening period. Some so called large-tick stocks behave differently because of technical boundaries. Their spread closes to one tick shortly after the market opening. We use our findings for identifying the duration of the market opening which we find to vary largely from stock to stock.
AI Key Findings
Get AI-generated insights about this paper's methodology, results, and significance.
Paper Details
PDF Preview
Key Terms
Citation Network
Current paper (gray), citations (green), references (blue)
Display is limited for performance on very large graphs.
Similar Papers
Found 4 papersRevisiting Cont's Stylized Facts for Modern Stock Markets
Ethan Ratliff-Crain, Colin M. Van Oort, James Bagrow et al.
| Title | Authors | Year | Actions |
|---|
Comments (0)