Estimation and Inference for Change Points in Functional Regression Time Series
Publication
Metrics
AI Quick Summary
This paper introduces a Functional Regression Binary Segmentation (FRBS) algorithm for detecting change points in functional linear regression models, achieving consistency and computational efficiency. It proposes a refinement step and a consistent block-type long-run variance estimator for constructing confidence intervals, validated through simulations and an application to the S&P 500 index.
Paper Preview
Abstract
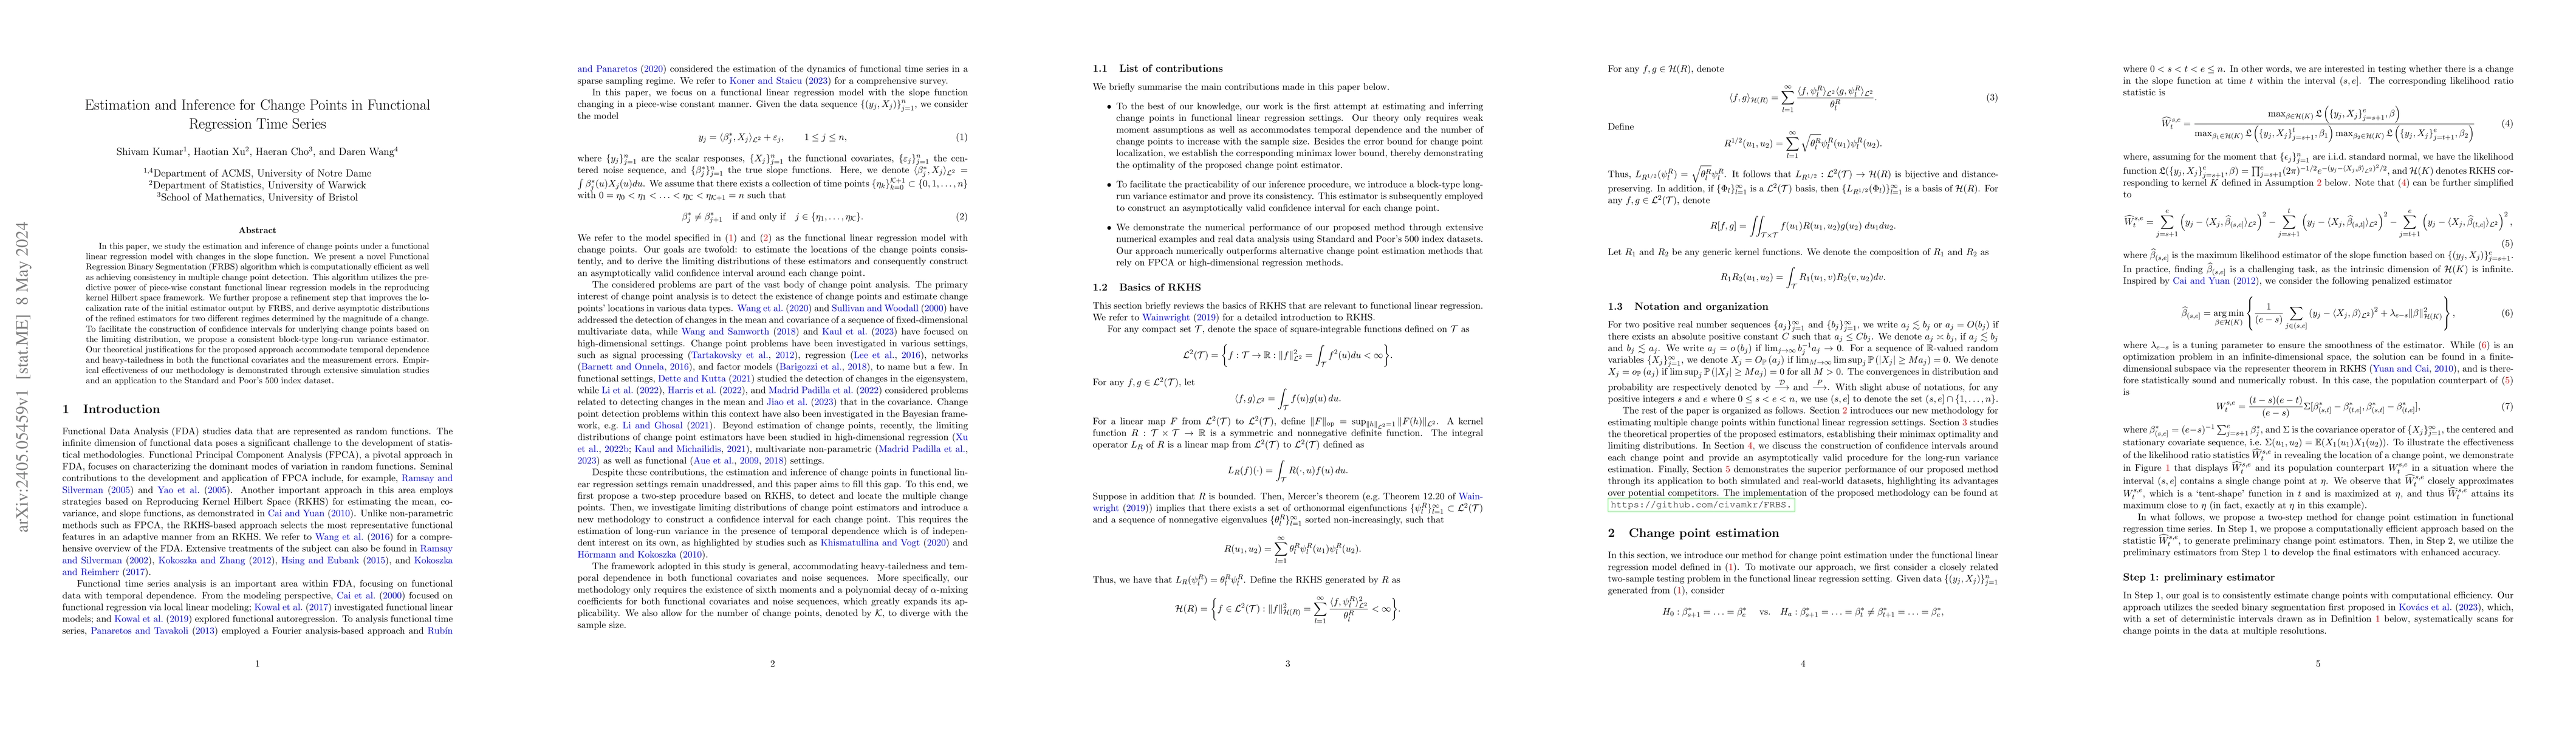
In this paper, we study the estimation and inference of change points under a functional linear regression model with changes in the slope function. We present a novel Functional Regression Binary Segmentation (FRBS) algorithm which is computationally efficient as well as achieving consistency in multiple change point detection. This algorithm utilizes the predictive power of piece-wise constant functional linear regression models in the reproducing kernel Hilbert space framework. We further propose a refinement step that improves the localization rate of the initial estimator output by FRBS, and derive asymptotic distributions of the refined estimators for two different regimes determined by the magnitude of a change. To facilitate the construction of confidence intervals for underlying change points based on the limiting distribution, we propose a consistent block-type long-run variance estimator. Our theoretical justifications for the proposed approach accommodate temporal dependence and heavy-tailedness in both the functional covariates and the measurement errors. Empirical effectiveness of our methodology is demonstrated through extensive simulation studies and an application to the Standard and Poor's 500 index dataset.
AI Key Findings
Get AI-generated insights about this paper's methodology, results, significance, and more — seven facets brought into focus.
Paper Details
Authors
PDF Preview
Key Terms
Related Papers
No references found for this paper.
Discussion 0