Evaluating the Effect of Timeline Shape on Visualization Task Performance
Publication
Metrics
Paper Preview
Abstract
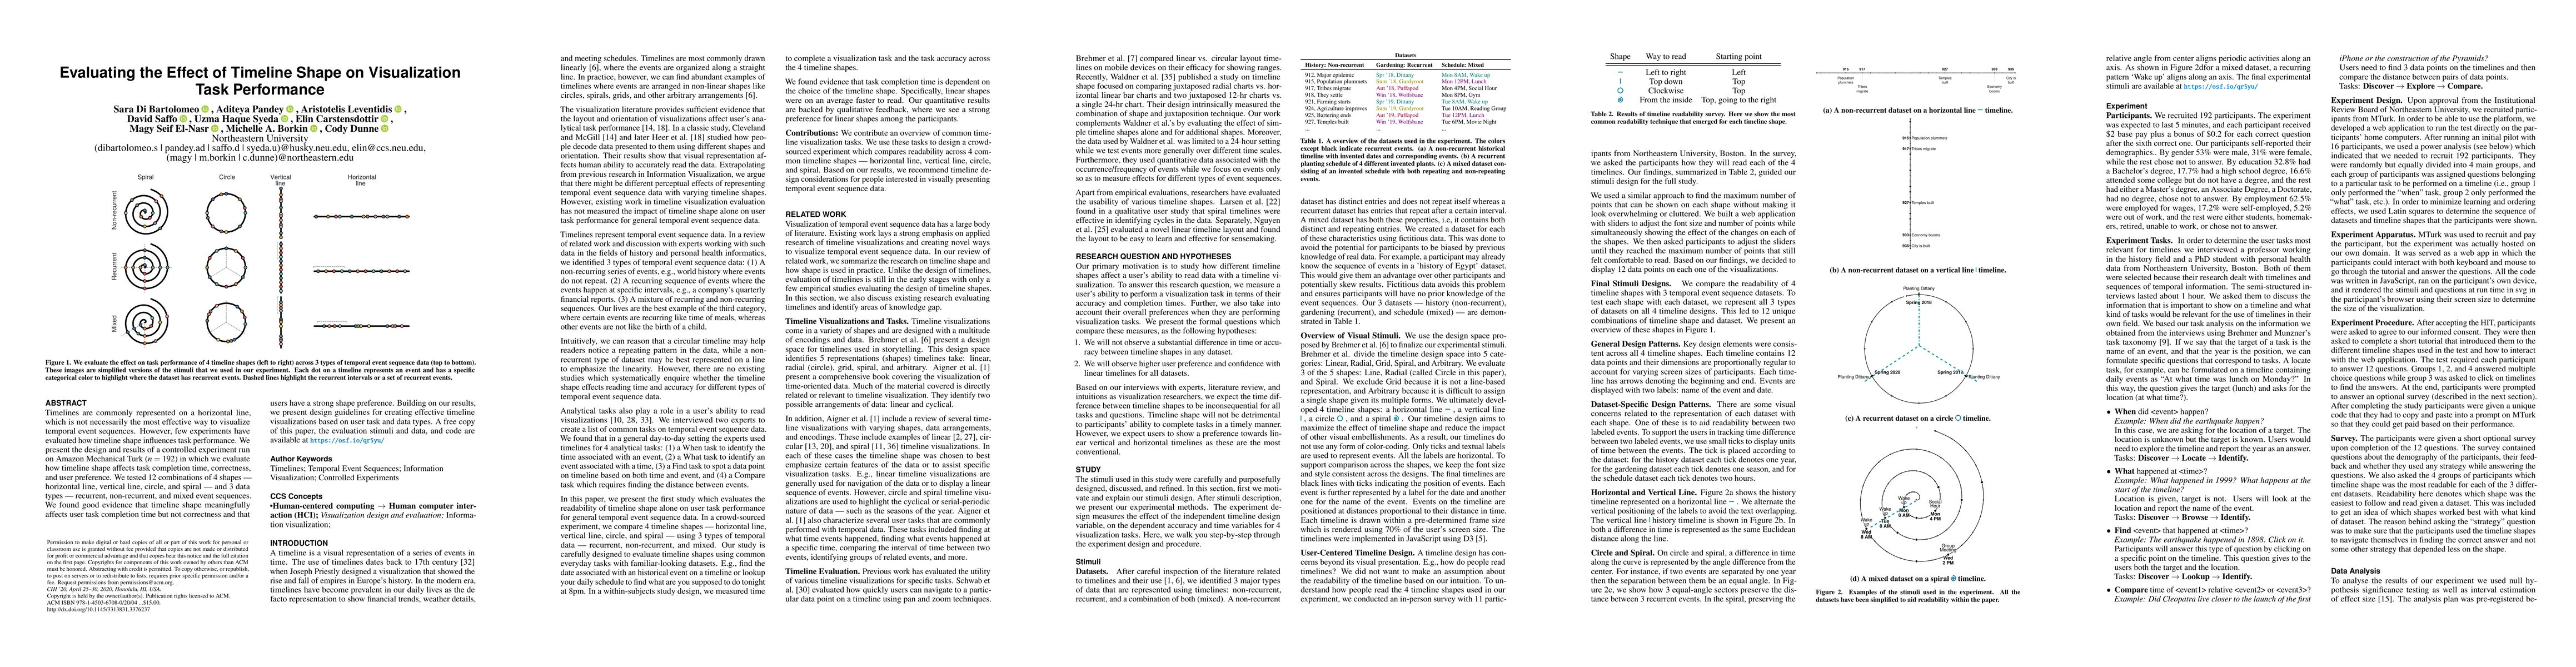
Timelines are commonly represented on a horizontal line, which is not necessarily the most effective way to visualize temporal event sequences. However, few experiments have evaluated how timeline shape influences task performance. We present the design and results of a controlled experiment run on Amazon Mechanical Turk (n=192) in which we evaluate how timeline shape affects task completion time, correctness, and user preference. We tested 12 combinations of 4 shapes -- horizontal line, vertical line, circle, and spiral -- and 3 data types -- recurrent, non-recurrent, and mixed event sequences. We found good evidence that timeline shape meaningfully affects user task completion time but not correctness and that users have a strong shape preference. Building on our results, we present design guidelines for creating effective timeline visualizations based on user task and data types. A free copy of this paper, the evaluation stimuli and data, and code are available at https://osf.io/qr5yu/
AI Key Findings
Get AI-generated insights about this paper's methodology, results, significance, and more — seven facets brought into focus.
Impact
Paper Details
Authors
PDF Preview
Key Terms
Citation Network
Current paper (gray), citations (green), references (blue)
Display is limited for performance on very large graphs.
Discussion 0