Summary
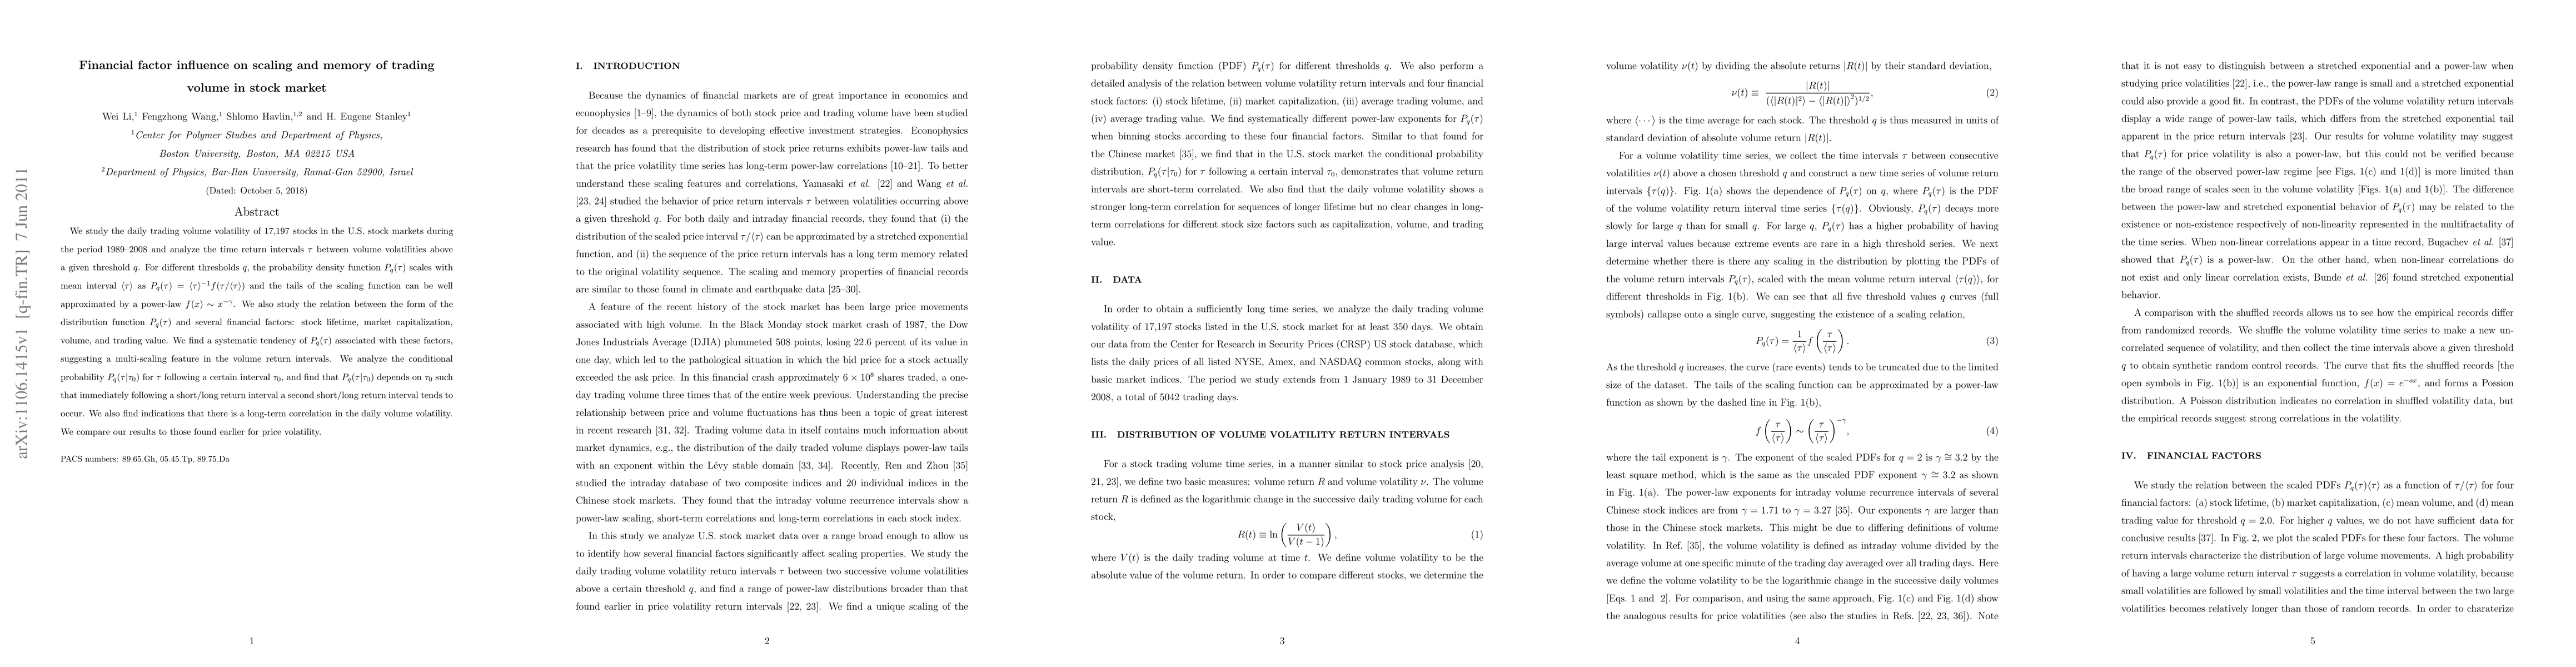
We study the daily trading volume volatility of 17,197 stocks in the U.S. stock markets during the period 1989--2008 and analyze the time return intervals $\tau$ between volume volatilities above a given threshold q. For different thresholds q, the probability density function P_q(\tau) scales with mean interval <\tau> as P_q(\tau)=<\tau>^{-1}f(\tau/<\tau>) and the tails of the scaling function can be well approximated by a power-law f(x)~x^{-\gamma}. We also study the relation between the form of the distribution function P_q(\tau) and several financial factors: stock lifetime, market capitalization, volume, and trading value. We find a systematic tendency of P_q(\tau) associated with these factors, suggesting a multi-scaling feature in the volume return intervals. We analyze the conditional probability P_q(\tau|\tau_0) for $\tau$ following a certain interval \tau_0, and find that P_q(\tau|\tau_0) depends on \tau_0 such that immediately following a short/long return interval a second short/long return interval tends to occur. We also find indications that there is a long-term correlation in the daily volume volatility. We compare our results to those found earlier for price volatility.
AI Key Findings
Get AI-generated insights about this paper's methodology, results, and significance.
Paper Details
PDF Preview
Key Terms
Citation Network
Current paper (gray), citations (green), references (blue)
Display is limited for performance on very large graphs.
Similar Papers
Found 4 papers| Title | Authors | Year | Actions |
|---|
Comments (0)