Publication
Metrics
AI Quick Summary
This paper proposes two econometric models—GARCH-Itô-OI and GARCH-Itô-IV—to forecast security volatility using low-frequency, high-frequency, and option-implied data. The GARCH-Itô-OI model treats option-implied volatility as an exogenous variable, while the GARCH-Itô-IV model constructs a relationship to extract underlying security information. Empirical results show that both models outperform other methods when high-frequency data has a 5-minute sampling interval.
Paper Preview
Abstract
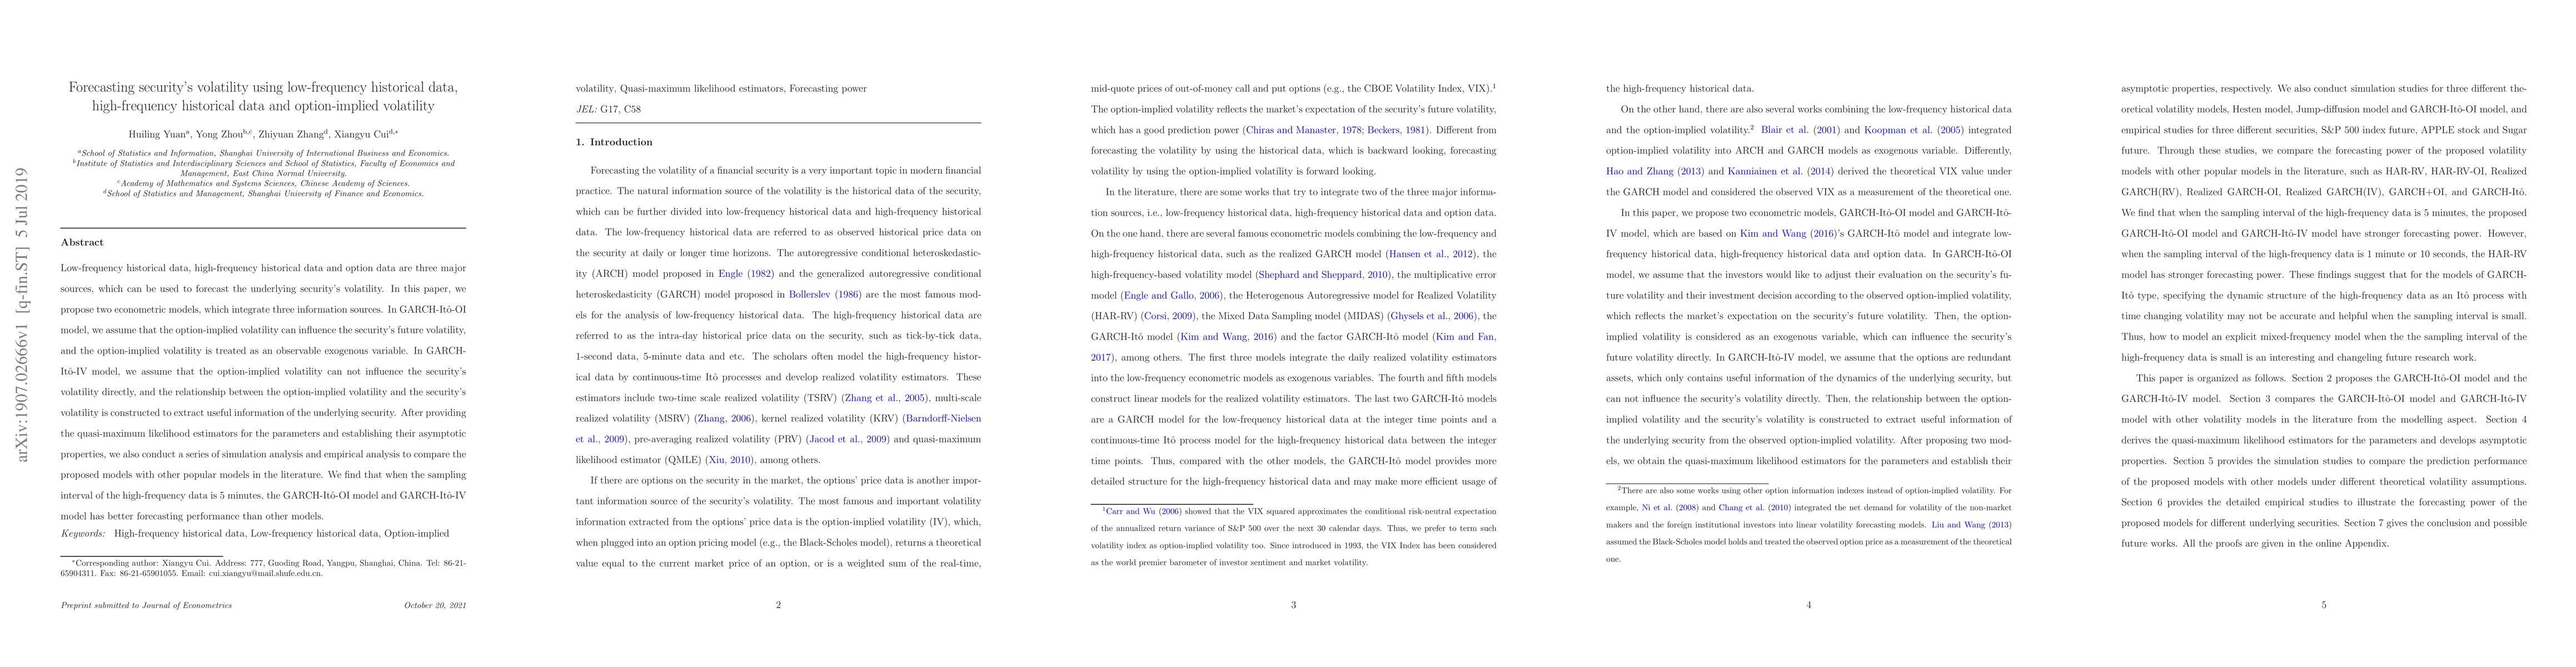
Low-frequency historical data, high-frequency historical data and option data are three major sources, which can be used to forecast the underlying security's volatility. In this paper, we propose two econometric models, which integrate three information sources. In GARCH-It\^{o}-OI model, we assume that the option-implied volatility can influence the security's future volatility, and the option-implied volatility is treated as an observable exogenous variable. In GARCH-It\^{o}-IV model, we assume that the option-implied volatility can not influence the security's volatility directly, and the relationship between the option-implied volatility and the security's volatility is constructed to extract useful information of the underlying security. After providing the quasi-maximum likelihood estimators for the parameters and establishing their asymptotic properties, we also conduct a series of simulation analysis and empirical analysis to compare the proposed models with other popular models in the literature. We find that when the sampling interval of the high-frequency data is 5 minutes, the GARCH-It\^{o}-OI model and GARCH-It\^{o}-IV model has better forecasting performance than other models.
AI Key Findings
Get AI-generated insights about this paper's methodology, results, significance, and more — seven facets brought into focus.
Impact
Paper Details
PDF Preview
Key Terms
Citation Network
Current paper (gray), citations (green), references (blue)
Display is limited for performance on very large graphs.
Discussion 0