This paper investigates the multifaceted roles of text in interactive dashboards, analyzing 190 real-world dashboards and conducting expert interviews to characterize current text usage practices. The authors propose 12 heuristics to guide best practices for text in dashboards, emphasizing its role in navigation and contextualization, and suggest avenues for future research to enhance text interactivity and personalization.
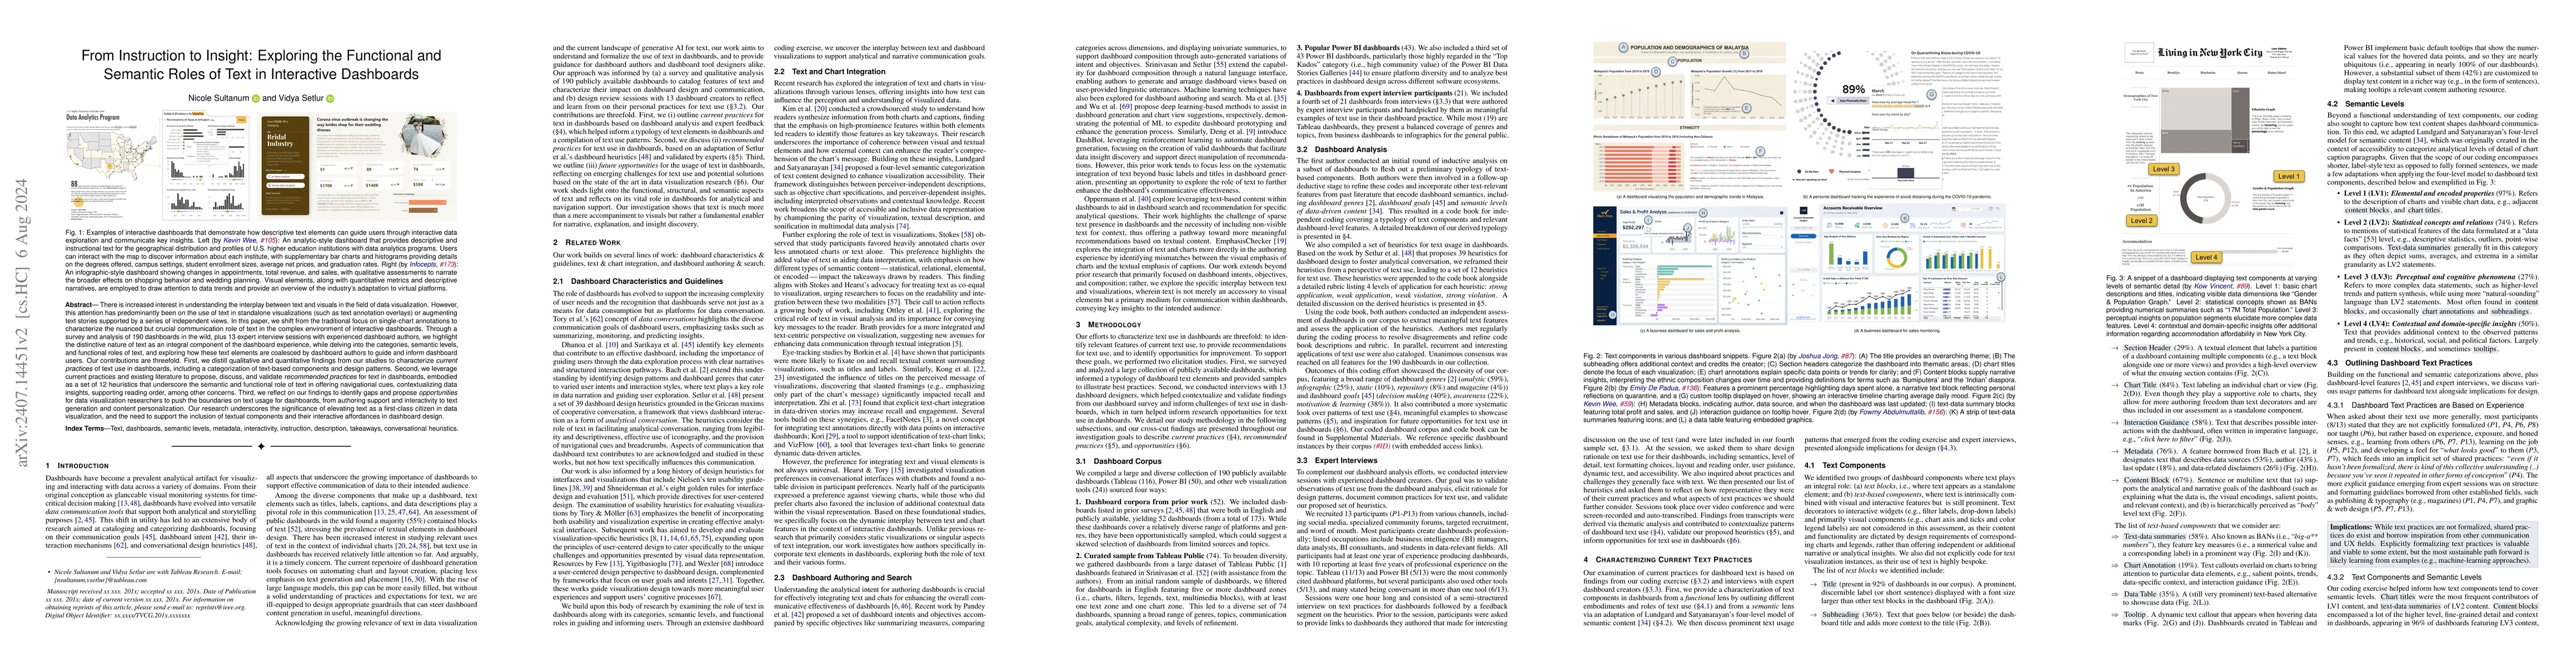
There is increased interest in the interplay between text and visuals in the field of data visualization. However, this attention has predominantly been on the use of text in standalone visualizations or augmenting text stories supported by a series of independent views. In this paper, we shift from the traditional focus on single-chart annotations to characterize the nuanced but crucial communication role of text in the complex environment of interactive dashboards. Through a survey and analysis of 190 dashboards in the wild, plus 13 expert interview sessions with experienced dashboard authors, we highlight the distinctive nature of text as an integral component of the dashboard experience, while delving into the categories, semantic levels, and functional roles of text, and exploring how these text elements are coalesced by dashboard authors to guide and inform dashboard users. Our contributions are: 1) we distill qualitative and quantitative findings from our studies to characterize current practices of text use in dashboards, including a categorization of text-based components and design patterns; 2) we leverage current practices and existing literature to propose, discuss, and validate recommended practices for text in dashboards, embodied as 12 heuristics that underscore the semantic and functional role of text in offering navigational cues, contextualizing data insights, supporting reading order, etc; 3) we reflect on our findings to identify gaps and propose opportunities for data visualization researchers to push the boundaries on text usage for dashboards, from authoring support and interactivity to text generation and content personalization. Our research underscores the significance of elevating text as a first-class citizen in data visualization, and the need to support the inclusion of textual components and their interactive affordances in dashboard design.
Get AI-generated insights about this paper's methodology, results, and significance.
Current paper (gray), citations (green), references (blue)
Nicole Sultanum, Vidya Setlur, Maxim Lisnic
Hao Zhang, Han Xu, Jiayi Ma et al.
Joshua B. Tenenbaum, Chuang Gan, Yi Gu et al.
Title | Authors | Year | Actions |
---|---|---|---|
Plume: Scaffolding Text Composition in Dashboards
|
Maxim Lisnic, V. Setlur, N. Sultanum
|
2025
|
View Paper |
Title | Authors | Year | Actions |
---|---|---|---|
Give Text A Chance: Advocating for Equal Consideration for Language and Visualization
|
Chase Stokes, Marti A. Hearst
|
2024
|
View Paper |
Umwelt: Accessible Structured Editing of Multi-Modal Data Representations
|
Jonathan Zong, Isabella Pedraza Pineros, M. Chen, Daniel Hajas, Arvind Satyanarayan
|
2024
|
View Paper |
Azimuth: Designing Accessible Dashboards for Screen Reader Users
|
Arjun Srinivasan, Tim Harshbarger, Darrell Hilliker, Jennifer Mankoff
|
2023
|
View Paper |
Show It or Tell It? Text, Visualization, and Their Combination
|
Marti A. Hearst
|
2023
|
View Paper |
Heuristics for Supporting Cooperative Dashboard Design
|
V. Setlur, M. Correll, Arvind Satyanarayan, Melanie Tory
|
2023
|
View Paper |
Toward a Scalable Census of Dashboard Designs in the Wild: A Case Study with Tableau Public
|
Joanna Purich, Arjun Srinivasan, M. Correll, L. Battle, V. Setlur, Anamaria Crisan
|
2023
|
View Paper |
Towards Visualization Thumbnail Designs That Entice Reading Data-Driven Articles
|
Hwiyeon Kim, Joohee Kim, Yunha Han, Hwajung Hong, Oh-Sang Kwon, Young-Woo Park, N. Elmqvist, Sungahn Ko, Bum Chul Kwon
|
2023
|
View Paper |
Is It the End? Guidelines for Cinematic Endings in Data Videos
|
Xian Xu, Aoyu Wu, Leni Yang, Zheng Wei, Rong Huang, D. Yip, Huamin Qu
|
2023
|
View Paper |
Notable: On-the-fly Assistant for Data Storytelling in Computational Notebooks
|
Haotian Li, Lu Ying, Haidong Zhang, Yingcai Wu, Huamin Qu, Yun Wang
|
2023
|
View Paper |
Affective Learning Objectives for Communicative Visualizations
|
Elsie Lee-Robbins, Eytan Adar
|
2022
|
View Paper |
M: Intent-based Recommendations to Support Dashboard Composition
|
Aditeya Pandey, Arjun Srinivasan, V. Setlur
|
2022
|
View Paper |
Striking a Balance: Reader Takeaways and Preferences when Integrating Text and Charts
|
Chase Stokes, V. Setlur, Bridget Cogley, Arvind Satyanarayan, Marti A. Hearst
|
2022
|
View Paper |
DashBot: Insight-Driven Dashboard Generation Based on Deep Reinforcement Learning
|
Dazhen Deng, Aoyu Wu, Huamin Qu, Yingcai Wu
|
2022
|
View Paper |
A Process Model for Dashboard Onboarding
|
Vaishali Dhanoa, C. Walchshofer, A. Hinterreiter, Holger Stitz, E. Groeller, M. Streit
|
2022
|
View Paper |
Dashboard Design Patterns
|
B. Bach, Euan Freeman, Alfie Abdul-Rahman, C. Turkay, Saiful Khan, Yulei Fan, Min Chen
|
2022
|
View Paper |
Evaluating the Effect of Enhanced Text-Visualization Integration on Combating Misinformation in Data Story
|
Chengbo Zheng, Xiaojuan Ma
|
2022
|
View Paper |
Integrating annotations into multidimensional visual dashboards
|
Sriram Karthik Badam, Senthil K. Chandrasegaran, N. Elmqvist
|
2022
|
View Paper |
Public
|
2022
|
View Paper | |
Perspectives of Visualization Onboarding and Guidance in VA
|
Christina Stoiber, D. Ceneda, Markus Wagner, V. Schetinger, T. Gschwandtner, M. Streit, S. Miksch, W. Aigner
|
2022
|
View Paper |
Roslingifier: Semi-Automated Storytelling for Animated Scatterplots
|
Minjeong Shin, Joohee Kim, Yunha Han, Lexing Xie, M. Whitelaw, Bum Chul Kwon, Sungahn Ko, N. Elmqvist
|
2022
|
View Paper |
ChartText: Linking Text with Charts in Documents
|
J. Pinheiro, Jorge Poco
|
2022
|
View Paper |
Finding Their Data Voice: Practices and Challenges of Dashboard Users
|
Melanie Tory, L. Bartram, Brittany Fiore-Gartland, Anamaria Crisan
|
2021
|
View Paper |
Accessible Visualization via Natural Language Descriptions: A Four-Level Model of Semantic Content
|
Alan Lundgard, Arvind Satyanarayan
|
2021
|
View Paper |
VizLinter: A Linter and Fixer Framework for Data Visualization
|
Qing Chen, F. Sun, Xinyue Xu, Zui Chen, Jiazhe Wang, Nan Cao
|
2021
|
View Paper |
Kori: Interactive Synthesis of Text and Charts in Data Documents
|
Shahid Latif, Zhengzhong Zhou, Yoon Kim, Fabian Beck, N. Kim
|
2021
|
View Paper |
MultiVision: Designing Analytical Dashboards with Deep Learning Based Recommendation
|
Aoyu Wu, Yun Wang, Mengyu Zhou, Xinyi He, Haidong Zhang, Huamin Qu, Dongmei Zhang
|
2021
|
View Paper |
A Deeper Understanding of Visualization‐Text Interplay in Geographic Data‐driven Stories
|
T. V. Landesberger, Shahid Latif, Siming Chen, Fabian Beck
|
2021
|
View Paper |
Leveraging Text-Chart Links to Support Authoring of Data-Driven Articles with VizFlow
|
N. Sultanum, Fanny Chevalier, Z. Bylinskii, Zhicheng Liu
|
2021
|
View Paper |
Towards Understanding How Readers Integrate Charts and Captions: A Case Study with Line Charts
|
Dae Hyun Kim, V. Setlur, Maneesh Agrawala
|
2021
|
View Paper |
Visualizing with Text
|
R. Brath
|
2020
|
View Paper |
Calliope: Automatic Visual Data Story Generation from a Spreadsheet
|
Danqing Shi, Xinyue Xu, F. Sun, Yang Shi, Nan Cao
|
2020
|
View Paper |
VizCommender: Computing Text-Based Similarity in Visualization Repositories for Content-Based Recommendations
|
Michael Oppermann, R. Kincaid, T. Munzner
|
2020
|
View Paper |
AutoCaption: An Approach to Generate Natural Language Description from Visualization Automatically
|
Can Liu, Liwenhan Xie, Yun Han, Datong Wei, Xiaoru Yuan
|
2020
|
View Paper |
LADV: Deep Learning Assisted Authoring of Dashboard Visualizations From Images and Sketches
|
Ruixian Ma, Honghui Mei, Huihua Guan, Wei Huang, Fan Zhang, Chengye Xin, Wenzhuo Dai, Xiao Wen, Wei Chen
|
2020
|
View Paper |
Would You Like A Chart With That? Incorporating Visualizations into Conversational Interfaces
|
Marti A. Hearst, Melanie Tory
|
2019
|
View Paper |
Linking and Layout: Exploring the Integration of Text and Visualization in Storytelling
|
Qiyu Zhi, Alvitta Ottley, Ronald A. Metoyer
|
2019
|
View Paper |
Trust and Recall of Information across Varying Degrees of Title-Visualization Misalignment
|
H. Kong, Zhicheng Liu, Karrie Karahalios
|
2019
|
View Paper |
Increasing the Transparency of Research Papers with Explorable Multiverse Analyses
|
Pierre Dragicevic, Yvonne Jansen, Abhraneel Sarma, Matthew Kay, Fanny Chevalier
|
2019
|
View Paper |
What Do We Talk About When We Talk About Dashboards?
|
Alper Sarıkaya, M. Correll, L. Bartram, Melanie Tory, Danyel Fisher
|
2019
|
View Paper |
Augmenting Visualizations with Interactive Data Facts to Facilitate Interpretation and Communication
|
Arjun Srinivasan, S. Drucker, A. Endert, J. Stasko
|
2019
|
View Paper |
The Development of Heuristics for Evaluation of Dashboard Visualizations
|
D. Dowding, J. Merrill
|
2018
|
View Paper |
Frames and Slants in Titles of Visualizations on Controversial Topics
|
H. Kong, Zhicheng Liu, Karrie Karahalios
|
2018
|
View Paper |
Coupling Story to Visualization: Using Textual Analysis as a Bridge Between Data and Interpretation
|
Ronald A. Metoyer, Qiyu Zhi, Bart Janczuk, W. Scheirer
|
2017
|
View Paper |
Neural Style Transfer: A Review
|
Yongcheng Jing, Yezhou Yang, Zunlei Feng, Jingwen Ye, Mingli Song
|
2017
|
View Paper |
The Big Book of Dashboards: Visualizing Your Data Using Real-World Business Scenarios
|
Steve Wexler, A. Cotgreave, J. Shaffer
|
2017
|
View Paper |
Information Visualization Heuristics in Practical Expert Evaluation
|
H. Väätäjä, Jari Varsaluoma, T. Heimonen, Katariina Tiitinen, Jaakko Hakulinen, M. Turunen, Harri Nieminen, Petri Ihantola
|
2016
|
View Paper |
Beyond Memorability: Visualization Recognition and Recall
|
M. Borkin, Z. Bylinskii, N. Kim, C. Bainbridge, Chelsea S. Yeh, Daniel Borkin, H. Pfister, A. Oliva
|
2016
|
View Paper |
Guidelines for Effective Usage of Text Highlighting Techniques
|
Hendrik Strobelt, Daniela Oelke, Bum Chul Kwon, Tobias Schreck, H. Pfister
|
2016
|
View Paper |
More Than Telling a Story: Transforming Data into Visually Shared Stories
|
Bongshin Lee, N. Riche, Petra Isenberg, Sheelagh Carpendale
|
2015
|
View Paper |
Toward visualization-specific heuristic evaluation
|
Alvin E Tarrell, A. Fruhling, R. Borgo, C. Forsell, G. Grinstein, J. Scholtz
|
2014
|
View Paper |
Four Data Visualization Heuristics to Facilitate Reflection in Personal Informatics
|
Andrea Cuttone, Michael Kai Petersen, J. E. Larsen
|
2014
|
View Paper |
Extracting references between text and charts via crowdsourcing
|
Nicholas Kong, Marti A. Hearst, Maneesh Agrawala
|
2014
|
View Paper |
A Design Space of Visualization Tasks
|
Hans-Jörg Schulz, T. Nocke, M. Heitzler, H. Schumann
|
2013
|
View Paper |
A Multi-Level Typology of Abstract Visualization Tasks
|
M. Brehmer, T. Munzner
|
2013
|
View Paper |
Storytelling: The Next Step for Visualization
|
Robert Kosara, J. Mackinlay
|
2013
|
View Paper |
A review of dashboards in performance management: Implications for design and research
|
Ogan Yigitbasioglu, Oana Velcu
|
2012
|
View Paper |
Visualization Rhetoric: Framing Effects in Narrative Visualization
|
J. Hullman, N. Diakopoulos
|
2011
|
View Paper |
Narrative Visualization: Telling Stories with Data
|
E. Segel, Jeffrey Heer
|
2010
|
View Paper |
An heuristic set for evaluation in information visualization
|
C. Forsell, J. Johansson
|
2010
|
View Paper |
Visual Thinking for Design
|
C. Ware
|
2008
|
View Paper |
Heuristics for information visualization evaluation
|
T. Zuk, L. Schlesier, Petra Neumann, Mark S. Hancock, Sheelagh Carpendale
|
2006
|
View Paper |
Evaluating Visualizations: Do Expert Reviews Work?
|
Melanie Tory, Torsten Möller
|
2005
|
View Paper |
POWER
|
A. Tomlinson
|
1998
|
View Paper |
Designing the user interface strategies for effective human-computer interaction
|
1998
|
View Paper | |
Enhancing the explanatory power of usability heuristics
|
Jakob Nielsen
|
1994
|
View Paper |
The Visual Display of Quantitative Information
|
E. Tufte
|
1985
|
View Paper |
BOLT: A Natural Language Interface for Dashboard Authoring
|
Arjun Srinivasan, V. Setlur
|
2023
|
View Paper |
Power BI
|
Ralph Mercurio, Brian Merrill
|
2021
|
View Paper |
The Curious Case of Combining Text and Visualization
|
Alvitta Ottley, Aleksandra Kaszowska, R. Crouser, Evan M. Peck
|
2019
|
View Paper |
Linting for Visualization: Towards a Practical Automated Visualization Guidance System
|
A. Mcnutt, G. Kindlmann
|
2018
|
View Paper |
Bridging from Goals to Tasks with Design Study Analysis Reports
|
Heidi Lam, Melanie Tory, T. Munzner
|
2018
|
View Paper |
Information Dashboard Design The Effective Visual Communication Of Data
|
S. Boehm
|
2016
|
View Paper |
VisJockey : Enriching Data Stories through Orchestrated Interactive Visualization
|
Bum Chul Kwon, Florian Stoffel, Dominik Jäckle, Bongshin Lee, D. Keim
|
2014
|
View Paper |
Scientific communication as sequential art
|
2011
|
||
Ten Usability Heuristics
|
J. Nielsen
|
2006
|
View Paper |
Interaction Guidance (58%). Text that describes possible interactions with the dashboard, often written in imperative language
|
|||
Our coding exercise helped inform how text components semantic levels
|
|||
The list of text-based components that we consider
|
|||
EMPHASIS-CHECKER: A Tool for Guiding Chart and Caption Emphasis
|
|||
Text-data summaries (58%). Also known as BANs (i.e., “big-a** numbers” ), they feature key measures (i.e., a numerical value and a corresponding label) in a prominent way (Fig. 2(I) and (K))
|
|||
Implications: While text practices are not formalized, shared practices do exist and borrow inspiration from other communication and UX fields
|
|||
Tooltip. A dynamic text callout that appears when hovering data marks (Fig. 2(G) and (J))
|
|||
Data Table (35%). A (still very prominent) text-based alternative to showcase data (Fig. 2(L))
|
|||
Chart Title (84%). Text labeling an individual chart or view (Fig. 2(D))
|
|||
THE FUNCTIONAL AND SEMANTIC ROLES OF TEXT
|
|||
Metadata (76%). A feature borrowed from Bach et al. [2], it designates text that describes data sources (53%), author (43%), last update (18%), and data-related disclaimers (26%) (Fig. 2(H))
|
|||
license agreement with IEEE. Restrictions apply
|
|||
Chart Annotation (19%). Text callouts overlaid on charts to bring attention to particular data elements
|
Showing first page preview. Click "Open Full PDF" to view the complete paper.
Your comment contains inappropriate language and has been rejected.
Are you sure you want to remove this tag? This action cannot be undone.
Someone just favorited a paper!
Comments (0)