Publication
Metrics
AI Quick Summary
GestureMap is a visual analytics tool that uses 2D embeddings from a Variational Autoencoder to visualize gesture spaces. It integrates DTW Barycenter Averaging and k-means clustering to represent, measure, and explore gesture data, facilitating insights into large datasets and comparisons across studies.
Paper Preview
Abstract
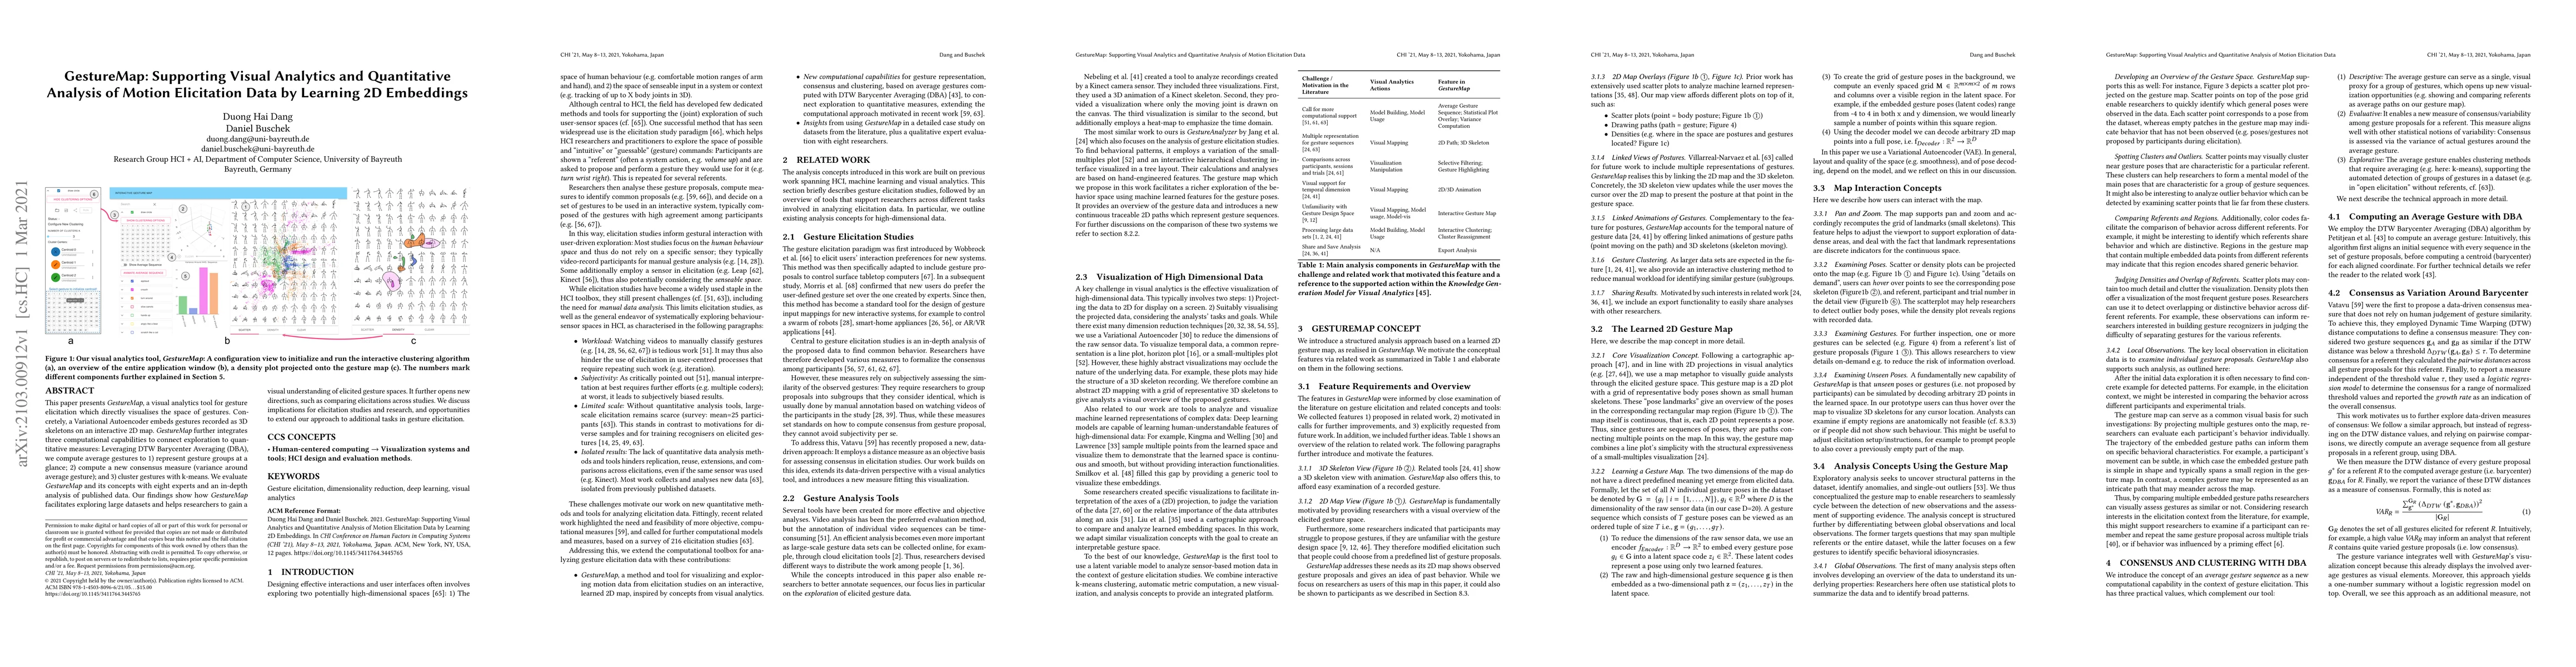
This paper presents GestureMap, a visual analytics tool for gesture elicitation which directly visualises the space of gestures. Concretely, a Variational Autoencoder embeds gestures recorded as 3D skeletons on an interactive 2D map. GestureMap further integrates three computational capabilities to connect exploration to quantitative measures: Leveraging DTW Barycenter Averaging (DBA), we compute average gestures to 1) represent gesture groups at a glance; 2) compute a new consensus measure (variance around average gesture); and 3) cluster gestures with k-means. We evaluate GestureMap and its concepts with eight experts and an in-depth analysis of published data. Our findings show how GestureMap facilitates exploring large datasets and helps researchers to gain a visual understanding of elicited gesture spaces. It further opens new directions, such as comparing elicitations across studies. We discuss implications for elicitation studies and research, and opportunities to extend our approach to additional tasks in gesture elicitation.
AI Key Findings
Get AI-generated insights about this paper's methodology, results, significance, and more — seven facets brought into focus.
Impact
Paper Details
Authors
PDF Preview
Key Terms
Citation Network
Current paper (gray), citations (green), references (blue)
Display is limited for performance on very large graphs.
Discussion 0