GMOL: An Interactive Tool for 3D Genome Structure Visualization
Publication
Metrics
Paper Preview
Abstract
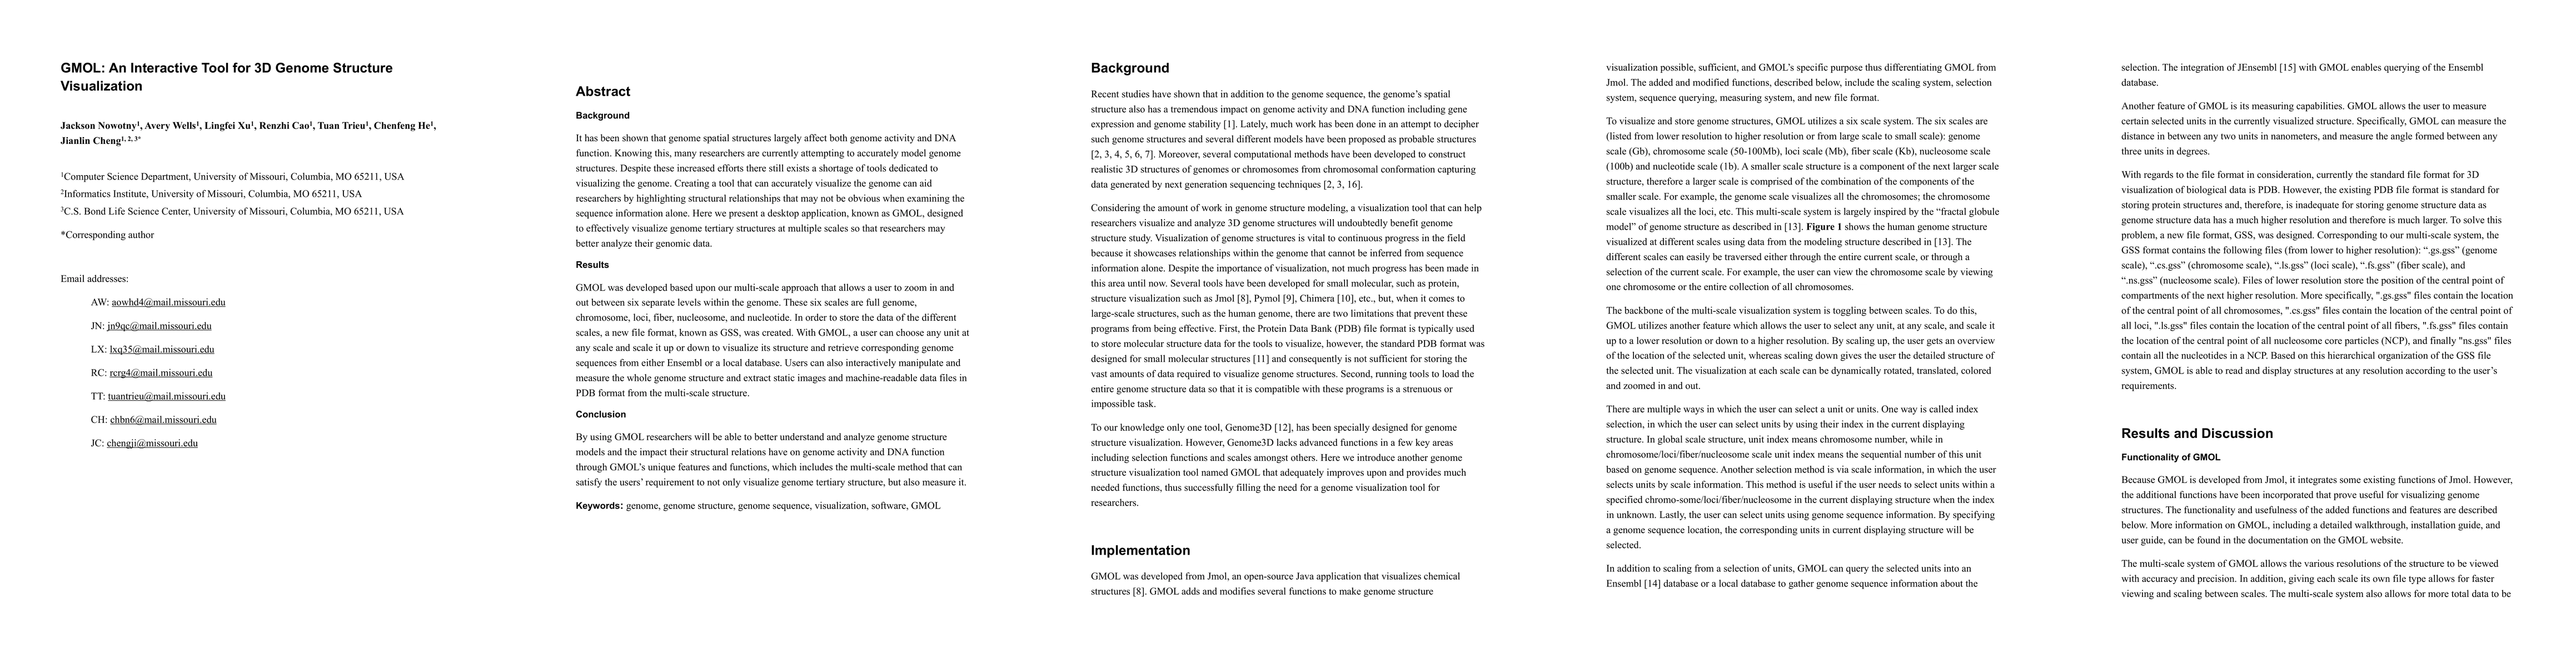
It has been shown that genome spatial structures largely affect both genome activity and DNA function. Knowing this, many researchers are currently attempting to accurately model genome structures. Despite these increased efforts there still exists a shortage of tools dedicated to visualizing the genome. Creating a tool that can accurately visualize the genome can aid researchers by highlighting structural relationships that may not be obvious when examining the sequence information alone. Here we present a desktop application, known as GMOL, designed to effectively visualize genome tertiary structures at multiple scales so that researchers may better analyze their genomic data. GMOL was developed based upon our multi-scale approach that allows a user to zoom in and out between six separate levels within the genome. These six scales are full genome, chromosome, loci, fiber, nucleosome, and nucleotide. In order to store the data of the different scales, a new file format, known as GSS, was created. With GMOL, a user can choose any unit at any scale and scale it up or down to visualize its structure and retrieve corresponding genome sequences from either Ensembl or a local database. Users can also interactively manipulate and measure the whole genome structure and extract static images and machine-readable data files in PDB format from the multi-scale structure. By using GMOL researchers will be able to better understand and analyze genome structure models and the impact their structural relations have on genome activity and DNA function through GMOLs unique features and functions, which includes the multi-scale method that can satisfy the users requirement to not only visualize genome tertiary structure, but also measure it.
AI Key Findings
Get AI-generated insights about this paper's methodology, results, significance, and more — seven facets brought into focus.
Impact
Paper Details
PDF Preview
Key Terms
Citation Network
Current paper (gray), citations (green), references (blue)
Display is limited for performance on very large graphs.
Discussion 0