01
MethodologyHow they did it
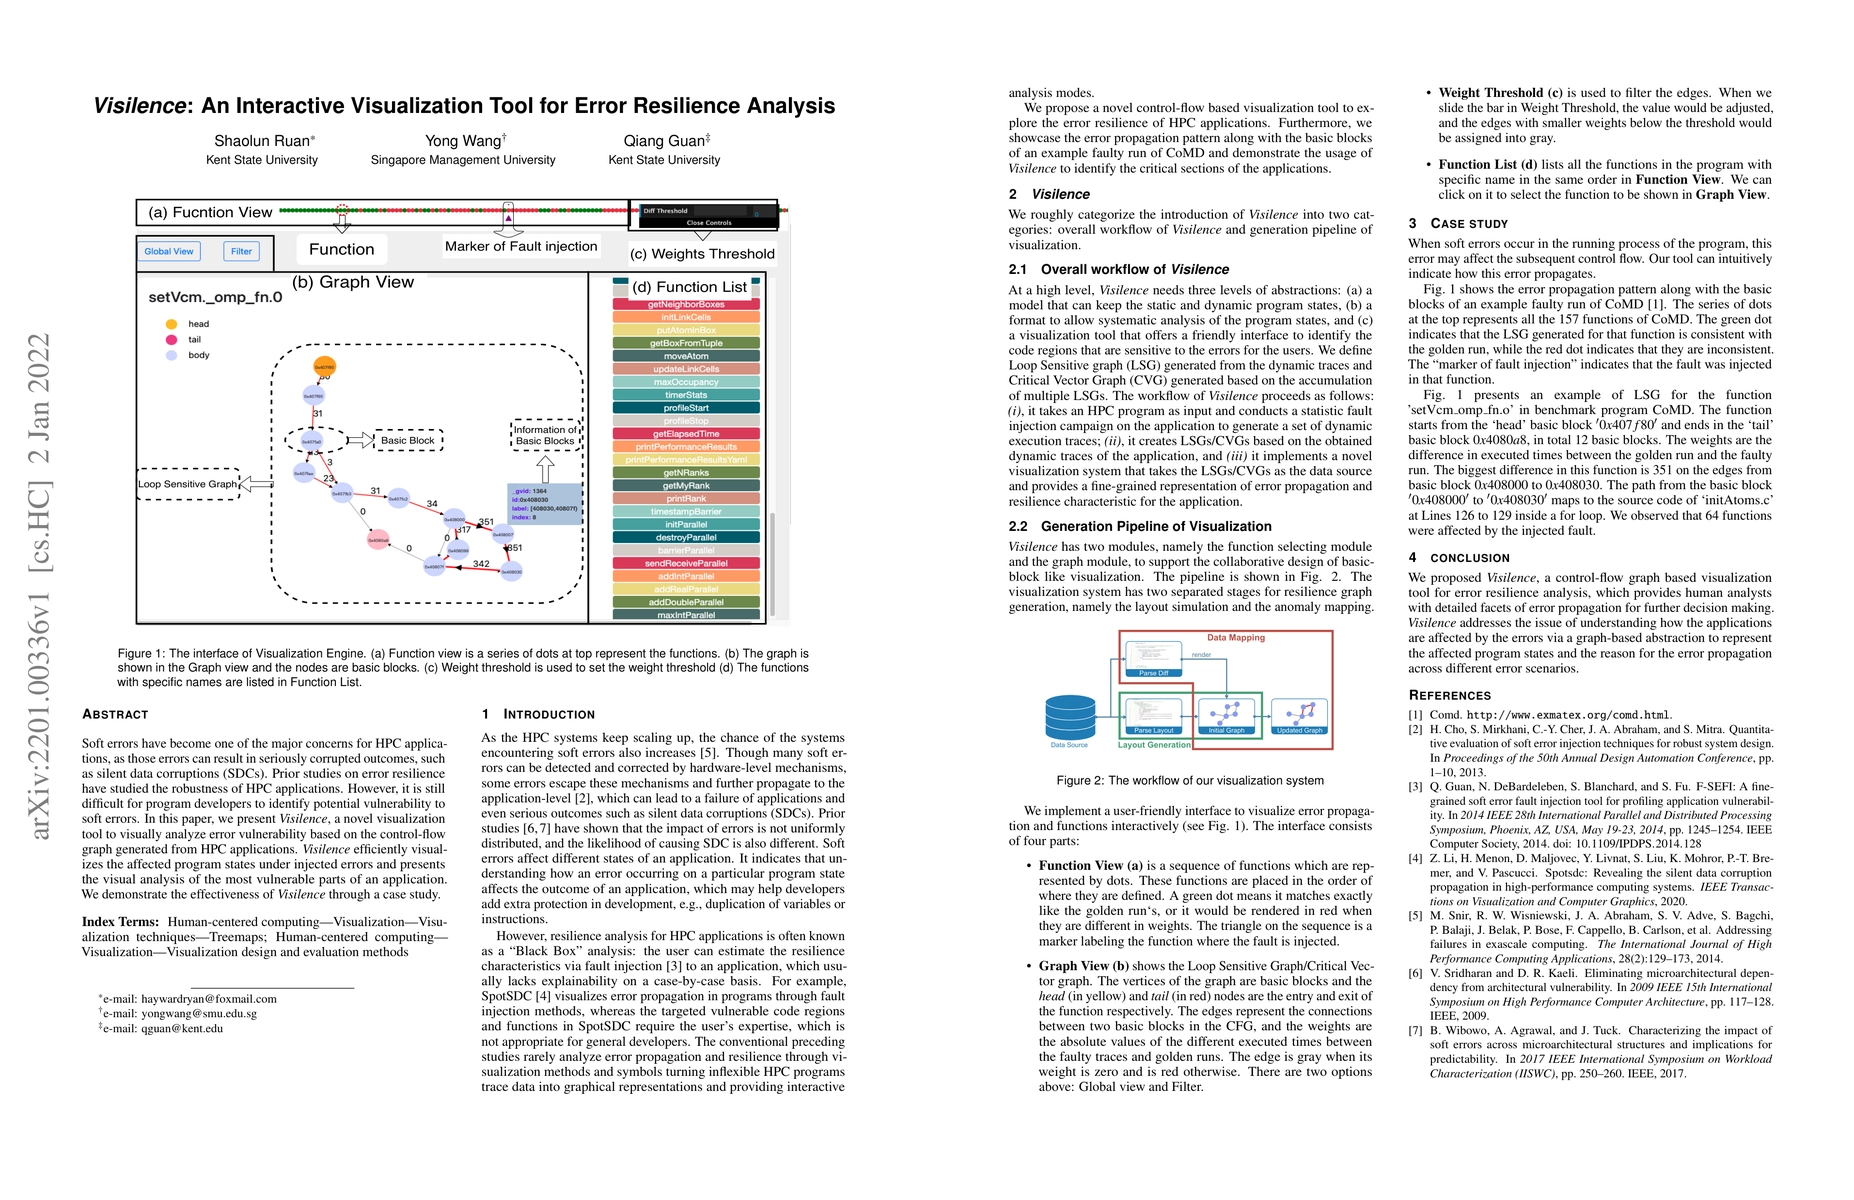
Visilence employs a three-level abstraction approach, including a model to maintain static and dynamic program states, a format for systematic program state analysis, and a visualization tool for identifying error-sensitive code regions. It uses Loop Sensitive Graphs (LSGs) generated from dynamic traces and Critical Vector Graphs (CVGs) based on accumulated LSGs. The workflow involves inputting an HPC program, conducting statistical fault injection, creating LSGs/CVGs, and implementing a visualization system for fine-grained error propagation and resilience representation.
Discussion 0