Graph Sphere: From Nodes to Supernodes in Graphical Models
Publication
Metrics
AI Quick Summary
This paper proposes a multilayer graphical model to identify complex structures like communities in high-dimensional data by clustering nodes into "supernodes" and modeling relationships among these groups. The approach leverages Bayesian nonparametrics and Voronoi tessellations for supernode formation and Gaussian graphical models for supernode relationships, supported by theoretical justification and efficient parallel computation methods.
Paper Preview
Abstract
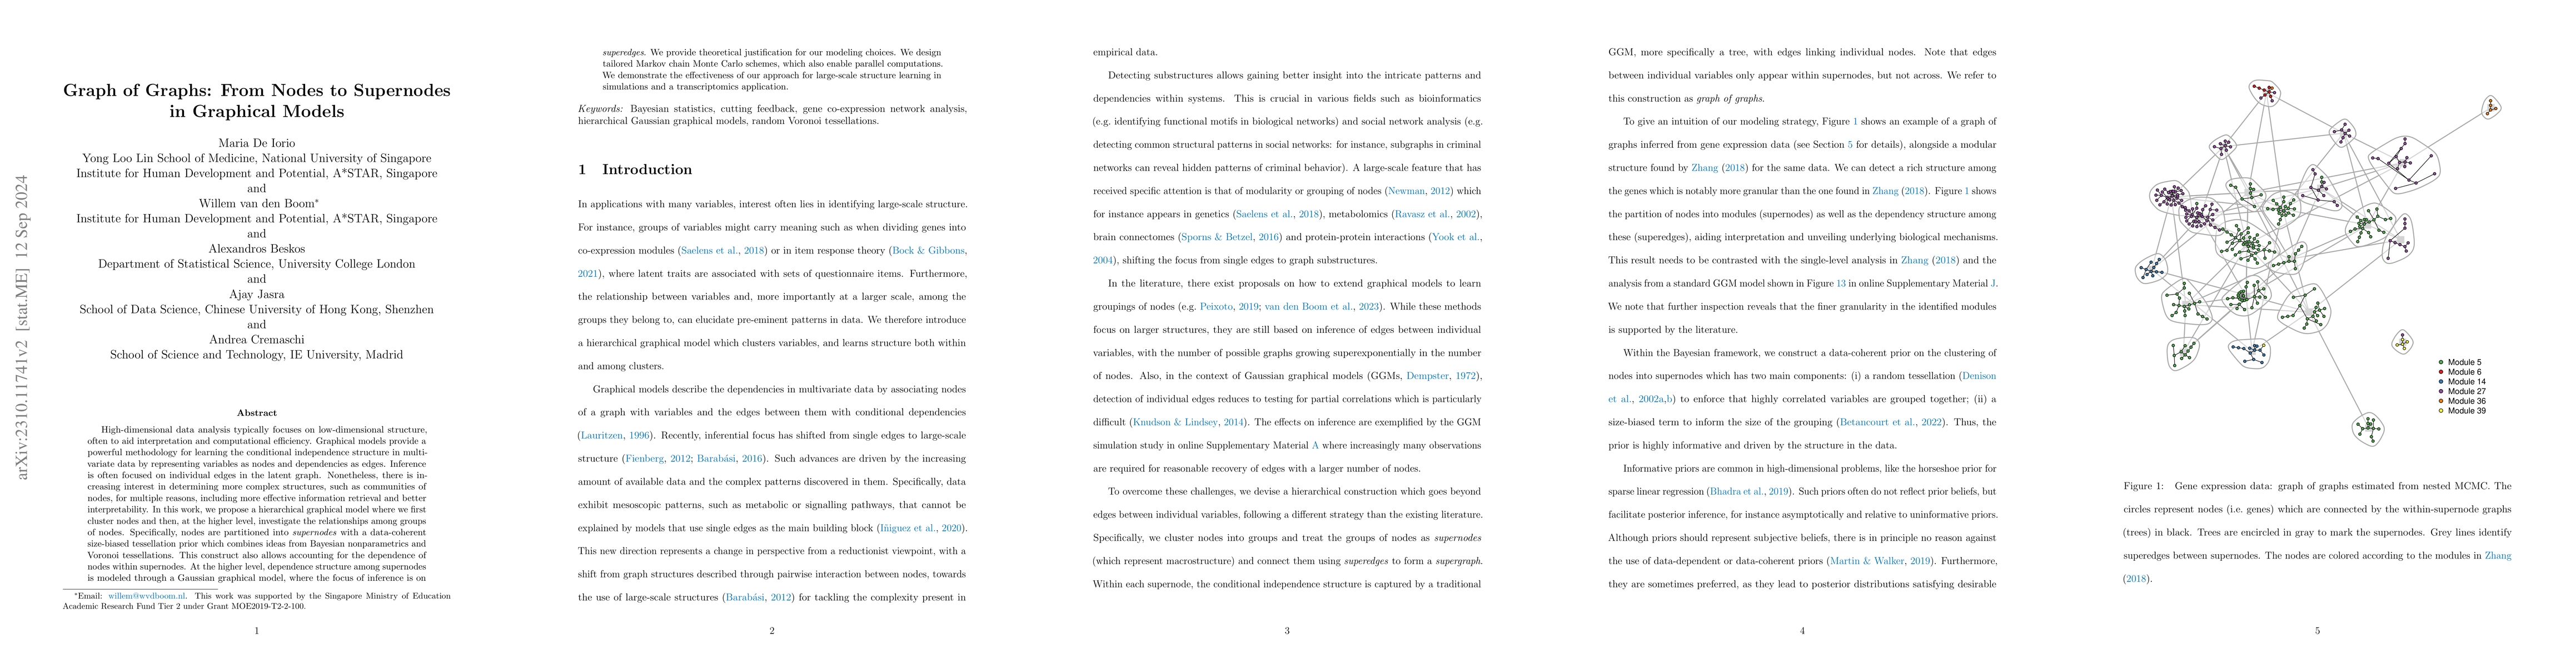
High-dimensional data analysis typically focuses on low-dimensional structure, often to aid interpretation and computational efficiency. Graphical models provide a powerful methodology for learning the conditional independence structure in multivariate data by representing variables as nodes and dependencies as edges. Inference is often focused on individual edges in the latent graph. Nonetheless, there is increasing interest in determining more complex structures, such as communities of nodes, for multiple reasons, including more effective information retrieval and better interpretability. In this work, we propose a multilayer graphical model where we first cluster nodes and then, at the second layer, investigate the relationships among groups of nodes. Specifically, nodes are partitioned into "supernodes" with a data-coherent size-biased tessellation prior which combines ideas from Bayesian nonparametrics and Voronoi tessellations. This construct allows accounting also for dependence of nodes within supernodes. At the second layer, dependence structure among supernodes is modelled through a Gaussian graphical model, where the focus of inference is on "superedges". We provide theoretical justification for our modelling choices. We design tailored Markov chain Monte Carlo schemes, which also enable parallel computations. We demonstrate the effectiveness of our approach for large-scale structure learning in simulations and a transcriptomics application.
AI Key Findings
Get AI-generated insights about this paper's methodology, results, significance, and more — seven facets brought into focus.
Paper Details
Authors
PDF Preview
Key Terms
Related Papers
No references found for this paper.
Discussion 0