Graphical Models for Financial Time Series and Portfolio Selection
Publication
Metrics
AI Quick Summary
This paper explores various graphical models to construct optimal portfolios, demonstrating that methods like PCA-KMeans, autoencoders, and dynamic clustering can capture time-varying covariance patterns. The resulting portfolios outperformed the S&P 500 index, suggesting graphical models' effectiveness in asset management.
Paper Preview
Abstract
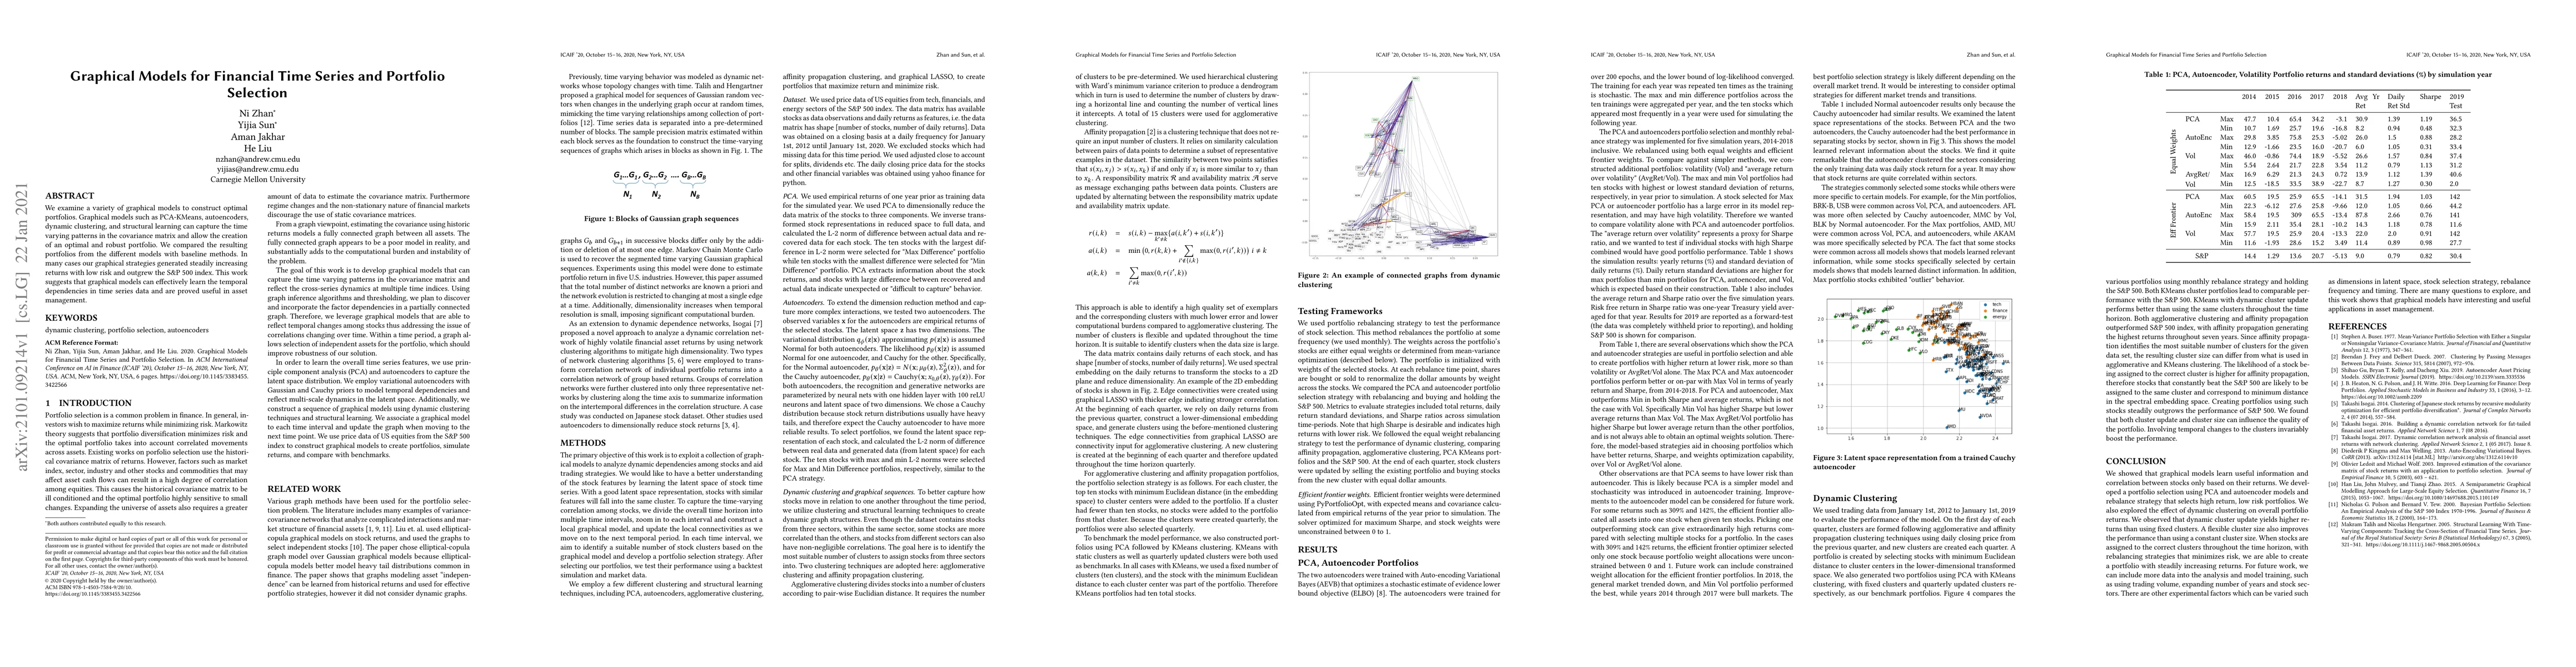
We examine a variety of graphical models to construct optimal portfolios. Graphical models such as PCA-KMeans, autoencoders, dynamic clustering, and structural learning can capture the time varying patterns in the covariance matrix and allow the creation of an optimal and robust portfolio. We compared the resulting portfolios from the different models with baseline methods. In many cases our graphical strategies generated steadily increasing returns with low risk and outgrew the S&P 500 index. This work suggests that graphical models can effectively learn the temporal dependencies in time series data and are proved useful in asset management.
AI Key Findings
Get AI-generated insights about this paper's methodology, results, significance, and more — seven facets brought into focus.
Impact
Paper Details
Authors
PDF Preview
Key Terms
Citation Network
Current paper (gray), citations (green), references (blue)
Display is limited for performance on very large graphs.
Discussion 0