Graphical outputs and Spatial Cross-validation for the R-INLA package using INLAutils
Publication
Metrics
AI Quick Summary
This paper discusses the R-INLA package's capabilities for fast Bayesian model fitting and the INLAutils package's tools for generating clear graphical summaries and spatial leave-one-out cross-validation for assessing model predictive performance, concluding with limitations and future enhancements.
Paper Preview
Abstract
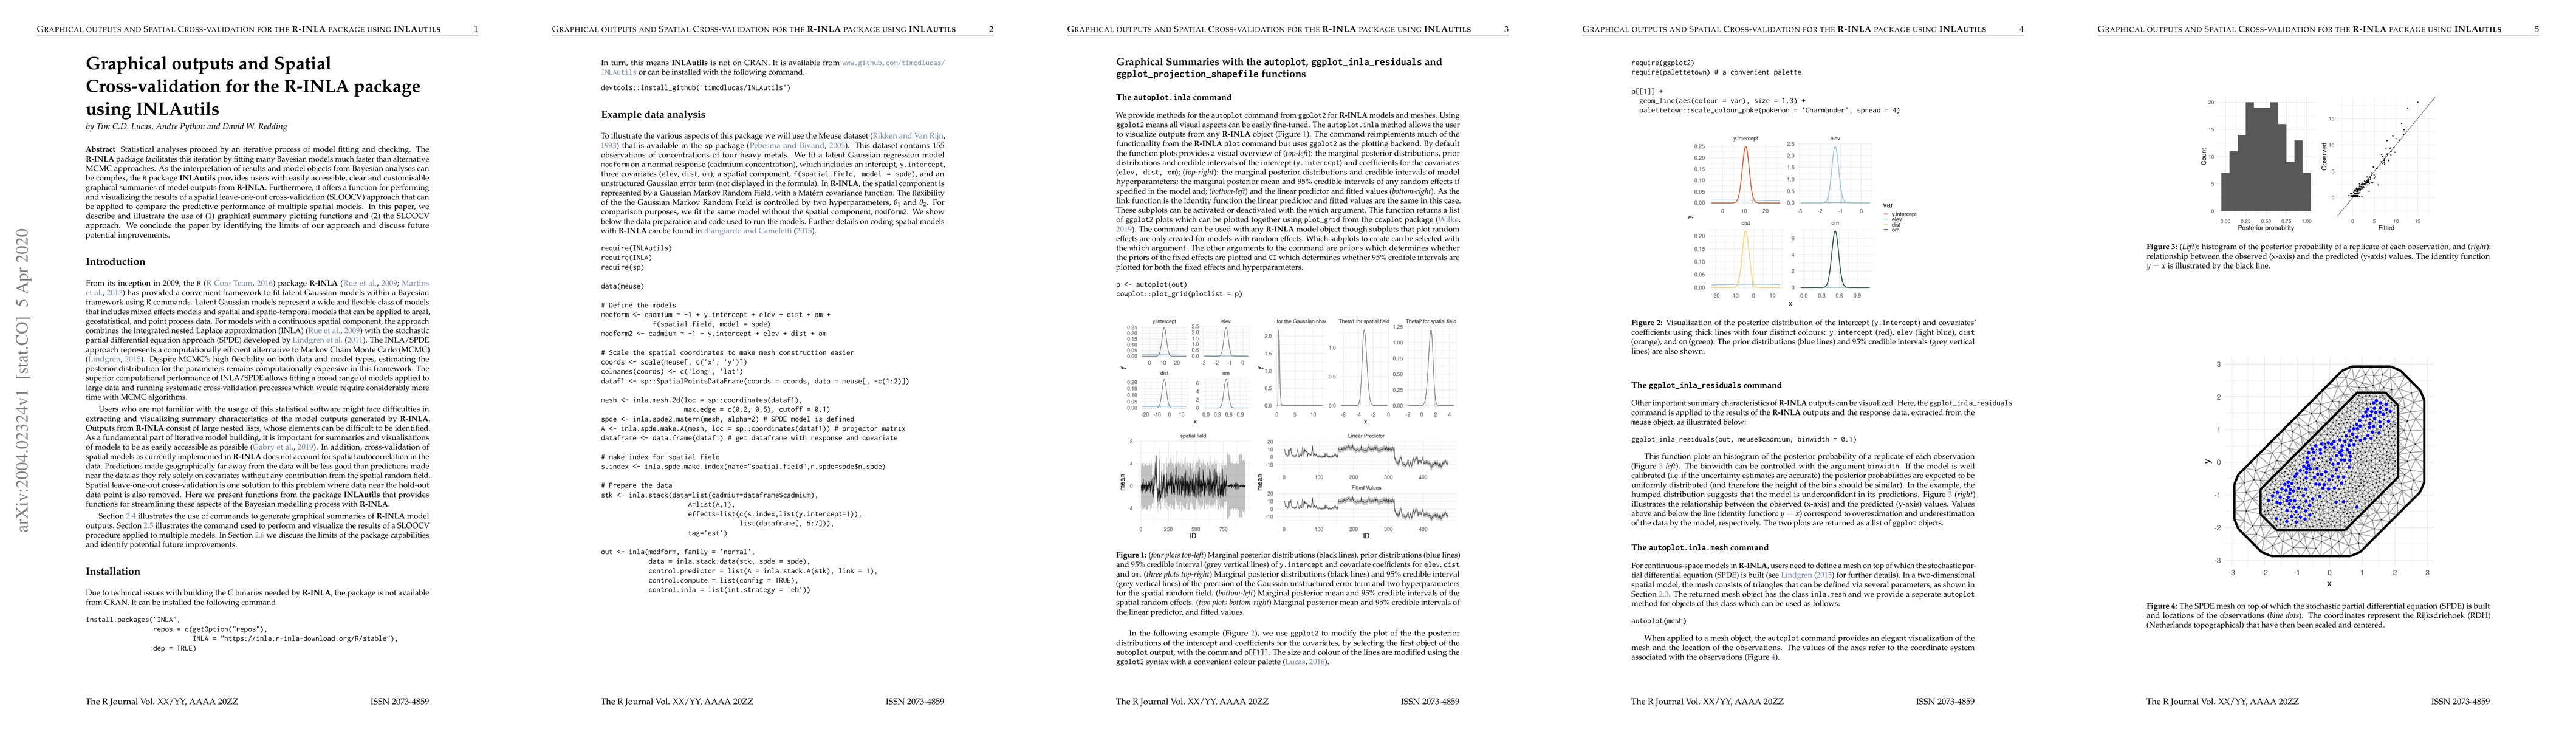
Statistical analyses proceed by an iterative process of model fitting and checking. The R-INLA package facilitates this iteration by fitting many Bayesian models much faster than alternative MCMC approaches. As the interpretation of results and model objects from Bayesian analyses can be complex, the R package INLAutils provides users with easily accessible, clear and customisable graphical summaries of model outputs from R- INLA. Furthermore, it offers a function for performing and visualizing the results of a spatial leave-one-out cross-validation (SLOOCV) approach that can be applied to compare the predictive performance of multiple spatial models. In this paper, we describe and illustrate the use of (1) graphical summary plotting functions and (2) the SLOOCV approach. We conclude the paper by identifying the limits of our approach and discuss future potential improvements.
AI Key Findings
Get AI-generated insights about this paper's methodology, results, significance, and more — seven facets brought into focus.
Impact
Paper Details
Authors
PDF Preview
Key Terms
Citation Network
Current paper (gray), citations (green), references (blue)
Display is limited for performance on very large graphs.
Discussion 0