GraphVista: Interactive Exploration Of Large Graphs
Publication
Metrics
AI Quick Summary
GraphVista is a tool enabling interactive exploration of large graph datasets, merging ad-hoc querying and visual graph exploration within a single session. It simplifies graph data analysis for users without prior graph query language knowledge, demonstrated through a real-world graph dataset at conferences.
Paper Preview
Abstract
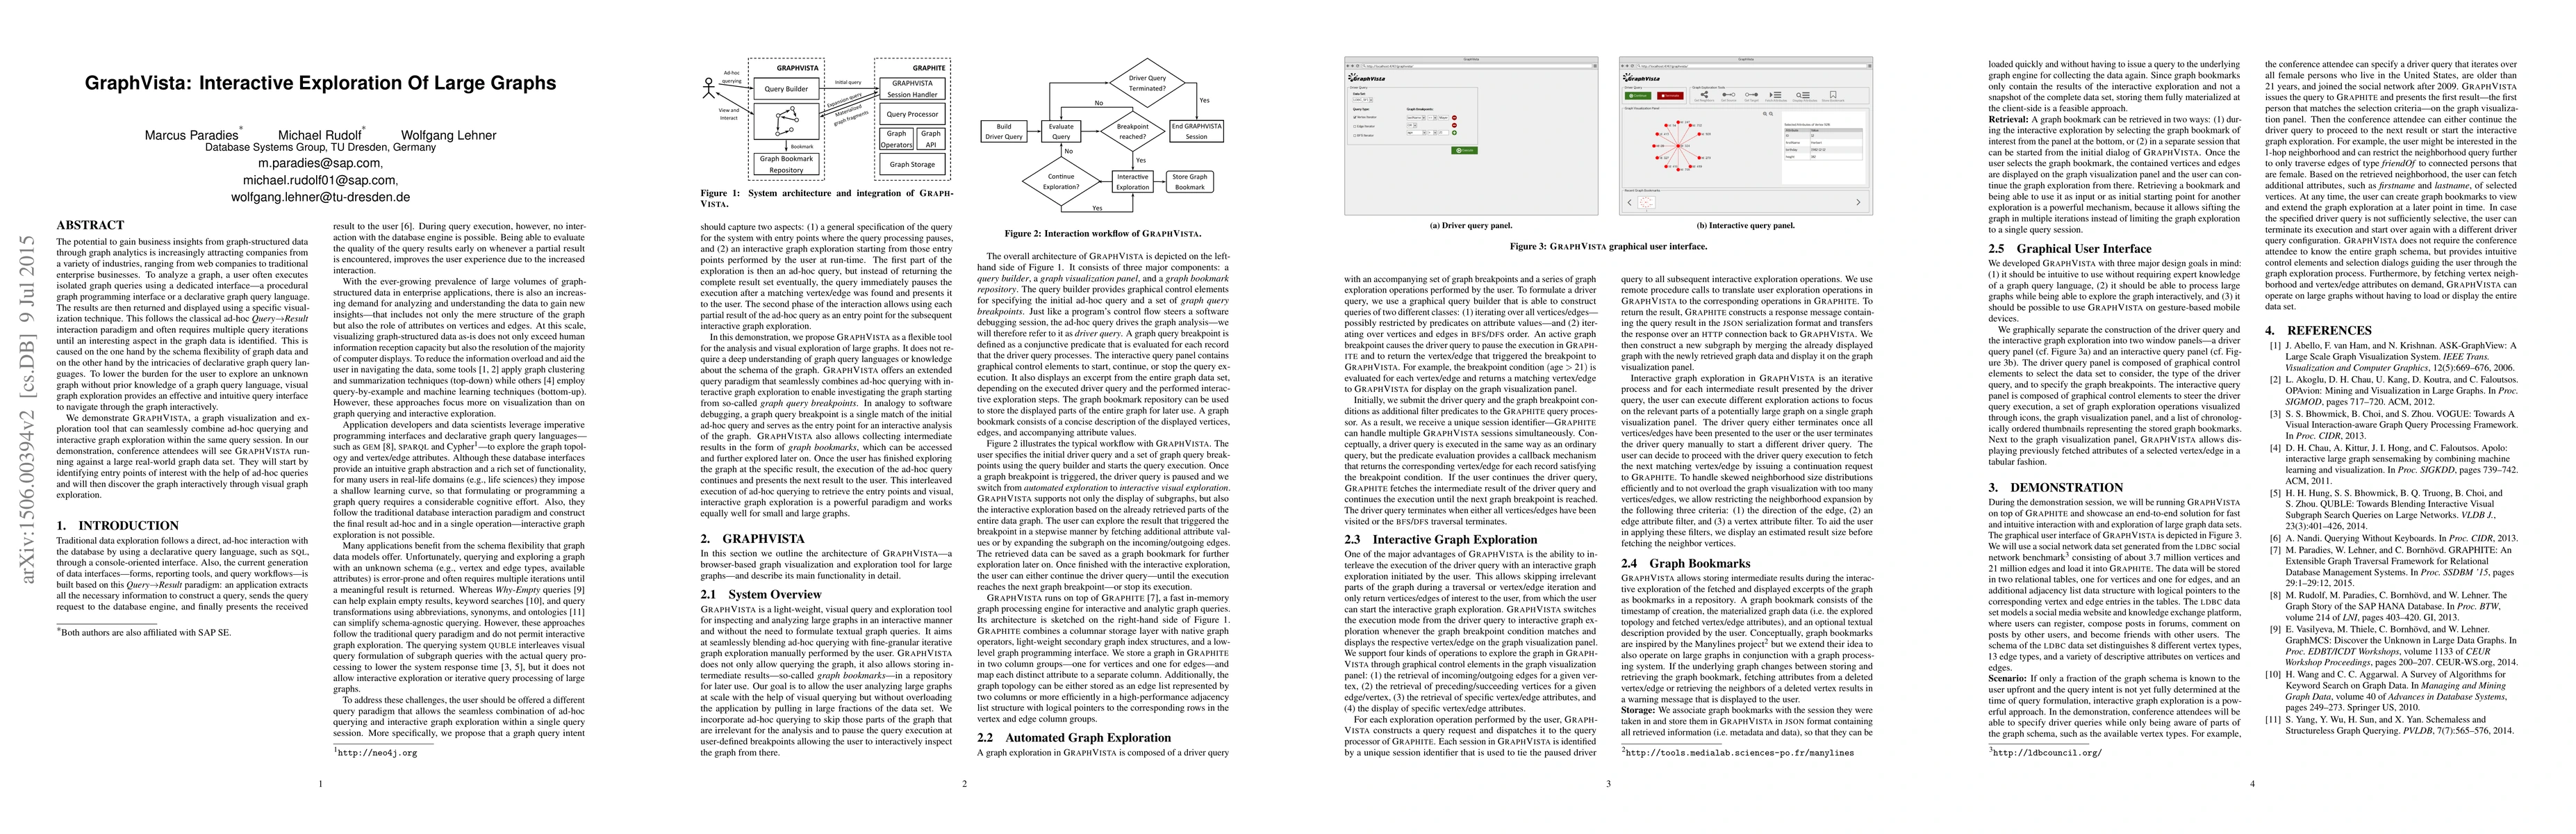
The potential to gain business insights from graph-structured data through graph analytics is increasingly attracting companies from a variety of industries, ranging from web companies to traditional enterprise businesses. To analyze a graph, a user often executes isolated graph queries using a dedicated interface---a procedural graph programming interface or a declarative graph query language. The results are then returned and displayed using a specific visualization technique. This follows the classical ad-hoc Query$\rightarrow$Result interaction paradigm and often requires multiple query iterations until an interesting aspect in the graph data is identified. This is caused on the one hand by the schema flexibility of graph data and on the other hand by the intricacies of declarative graph query languages. To lower the burden for the user to explore an unknown graph without prior knowledge of a graph query language, visual graph exploration provides an effective and intuitive query interface to navigate through the graph interactively. We demonstrate GRAPHVISTA, a graph visualization and exploration tool that can seamlessly combine ad-hoc querying and interactive graph exploration within the same query session. In our demonstration, conference attendees will see GRAPHVISTA running against a large real-world graph data set. They will start by identifying entry points of interest with the help of ad-hoc queries and will then discover the graph interactively through visual graph exploration.
AI Key Findings
Get AI-generated insights about this paper's methodology, results, significance, and more — seven facets brought into focus.
Impact
Paper Details
PDF Preview
Key Terms
Citation Network
Current paper (gray), citations (green), references (blue)
Display is limited for performance on very large graphs.
Discussion 0