This paper presents a new workflow for interactive hierarchical clustering with labeled prototypes to improve visualization of large datasets, restoring its role as an effective tool.
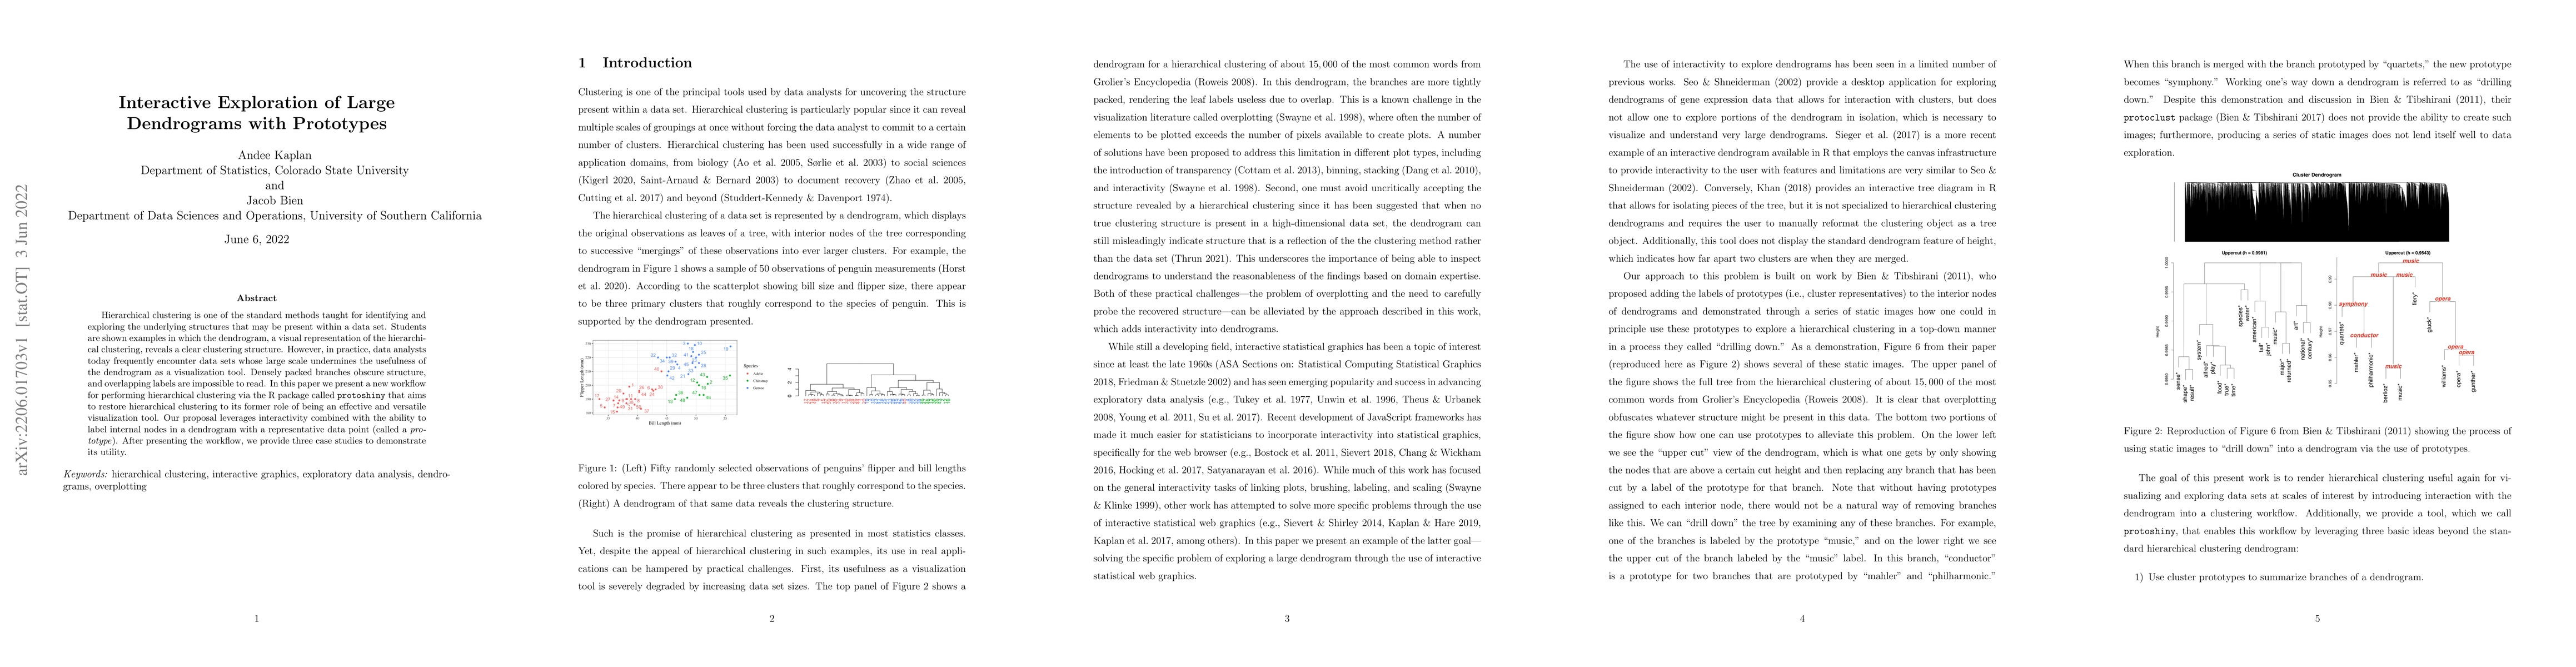
Hierarchical clustering is one of the standard methods taught for identifying and exploring the underlying structures that may be present within a data set. Students are shown examples in which the dendrogram, a visual representation of the hierarchical clustering, reveals a clear clustering structure. However, in practice, data analysts today frequently encounter data sets whose large scale undermines the usefulness of the dendrogram as a visualization tool. Densely packed branches obscure structure, and overlapping labels are impossible to read. In this paper we present a new workflow for performing hierarchical clustering via the R package called protoshiny that aims to restore hierarchical clustering to its former role of being an effective and versatile visualization tool. Our proposal leverages interactivity combined with the ability to label internal nodes in a dendrogram with a representative data point (called a prototype). After presenting the workflow, we provide three case studies to demonstrate its utility.
Get AI-generated insights about this paper's methodology, results, and significance.
Current paper (gray), citations (green), references (blue)
No similar papers found for this research.
Title | Authors | Year | Actions |
---|---|---|---|
Dependency-based clustering using correspondence and Ward's hierarchical analysis: a case study on clean water and sanitation indicators in West Java's cities and regencies
|
Theresia Samaria, Irlandia Nauli, Ginanjar, Defi Yusti, Faidah
|
2025
|
View Paper |
Title | Authors | Year | Actions |
---|---|---|---|
Distance-based clustering challenges for unbiased benchmarking studies
|
M. Thrun
|
2021
|
View Paper |
COVID-19 Outbreak Associated with Air Conditioning in Restaurant, Guangzhou, China, 2020
|
Ana M. Rule
|
2020
|
View Paper |
The Earth Mover’s Distance as a Metric for the Space of Inorganic Compositions
|
Cameron J. Hargreaves, M. Dyer, M. Gaultois, V. Kurlin, M. Rosseinsky
|
2020
|
View Paper |
Association between mobility patterns and COVID-19 transmission in the USA: a mathematical modelling study
|
H. Badr, H. Du, M. Marshall, E. Dong, Marietta M. Squire, L. Gardner
|
2020
|
View Paper |
Behind the Scenes of the Underworld: Hierarchical Clustering of Two Leaked Carding Forum Databases
|
Alex Kigerl
|
2020
|
View Paper |
Staying at Home: Mobility Effects of COVID-19
|
S. Engle, John Stromme, Anson Zhou
|
2020
|
View Paper |
The effect of human mobility and control measures on the COVID-19 epidemic in China
|
M. Kraemer, Chia-Hung Yang, B. Gutiérrez, Chieh-Hsi Wu, Brennan Klein, D. Pigott, L. du Plessis, Nuno R. Faria, Ruoran Li, W. Hanage, J. Brownstein, Maylis Layan, A. Vespignani, H. Tian, C. Dye, O. Pybus, S. Scarpino
|
2020
|
View Paper |
SeaFlow data v1, high-resolution abundance, size and biomass of small phytoplankton in the North Pacific
|
F. Ribalet, Chris T. Berthiaume, A. Hynes, J. Swalwell, Michael C. G. Carlson, S. Clayton, G. Hennon, Camille Poirier, E. Shimabukuro, A. White, E. Armbrust
|
2019
|
View Paper |
Vega-Lite: A Grammar of Interactive Graphics
|
Arvind Satyanarayan, Dominik Moritz, Kanit Wongsuphasawat, Jeffrey Heer
|
2018
|
View Paper |
Interactive Dendrograms: The R Packages idendro and idendr0
|
T. Sieger, C. Hurley, K. Fišer, C. Beleites
|
2017
|
View Paper |
Glimma: interactive graphics for gene expression analysis
|
Shian Su, C. Law, Casey Ah-Cann, M. Asselin-Labat, M. Blewitt, Matthew E. Ritchie
|
2017
|
View Paper |
Putting down roots: a graphical exploration of community attachment
|
Andee Kaplan, Eric R. Hare
|
2016
|
View Paper |
An interactive graphical method for community detection in network data
|
Andee Kaplan, H. Hofmann, D. Nordman
|
2016
|
View Paper |
Earth Mover’s Distance (EMD): A True Metric for Comparing Biomarker Expression Levels in Cell Populations
|
D. Orlova, Noah Zimmerman, Stephen Meehan, Connor Meehan, Jeffrey Waters, E. Ghosn, A. Filatenkov, G. A. Kolyagin, Y. Gernez, S. Tsuda, W. Moore, R. Moss, L. Herzenberg, G. Walther
|
2016
|
View Paper |
Tools to Make Developing R Packages Easier
|
H. Wickham, Winston Chang
|
2016
|
View Paper |
The MovieLens Datasets: History and Context
|
F. M. Harper, J. Konstan, J. A.
|
2016
|
View Paper |
LDAvis: A method for visualizing and interpreting topics
|
Carson Sievert, Kenneth E. Shirley
|
2014
|
View Paper |
Overplotting: Unified solutions under Abstract Rendering
|
Joseph A. Cottam, A. Lumsdaine, Peter Wang
|
2013
|
View Paper |
The Tag Genome: Encoding Community Knowledge to Support Novel Interaction
|
Jesse Vig, Shilad Sen, J. Riedl
|
2012
|
View Paper |
D³ Data-Driven Documents
|
M. Bostock, Vadim Ogievetsky, Jeffrey Heer
|
2011
|
View Paper |
SeaFlow: A novel underway flow‐cytometer for continuous observations of phytoplankton in the ocean
|
J. Swalwell, F. Ribalet, E. Armbrust
|
2011
|
View Paper |
Hierarchical Clustering With Prototypes via Minimax Linkage
|
J. Bien, R. Tibshirani
|
2011
|
View Paper |
Stacking Graphic Elements to Avoid Over-Plotting
|
Dang Tuan Nhon, Leland Wilkinson, Anushka Anand
|
2010
|
View Paper |
Interactive graphics for Data Analysis - Principles and Examples
|
M. Theus, Simon Urbanek
|
2008
|
View Paper |
Defining clusters from a hierarchical cluster tree: the Dynamic Tree Cut package for R
|
P. Langfelder, Bin Zhang, S. Horvath
|
2008
|
View Paper |
Scatter/gather
|
Staff
|
2006
|
View Paper |
Visual Statistics: Seeing Data with Dynamic Interactive Graphics
|
Forrest W Young Pedro Valero-Mora Michael
|
2006
|
View Paper |
CLUSTAG: hierarchical clustering and graph methods for selecting tag SNPs
|
S. Ao, Kevin Y. Yip, M. Ng, D. Cheung, P. Fong, I. Melhado, P. Sham
|
2005
|
View Paper |
Hierarchical Clustering Algorithms for Document Datasets
|
Ying Zhao, G. Karypis, U. Fayyad
|
2005
|
View Paper |
The Elements of Statistical Learning: Data Mining, Inference, and Prediction
|
D. Ruppert
|
2004
|
View Paper |
Convergence or Resilience? A Hierarchical Cluster Analysis of the Welfare Regimes in Advanced Countries
|
Sébastien Saint-Arnaud, P. Bernard
|
2003
|
View Paper |
The Elements of Statistical Learning
|
E. Ziegel
|
2003
|
View Paper |
Repeated observation of breast tumor subtypes in independent gene expression data sets
|
T. Sørlie, R. Tibshirani, Joel Parker, T. Hastie, J. Marron, A. Nobel, Shibing Deng, H. Johnsen, Robert Pesich, S. Geisler, J. Demeter, C. Perou, P. Lønning, P. Brown, A. Børresen-Dale, D. Botstein
|
2003
|
View Paper |
John W. Tukey's work on interactive graphics
|
J. Friedman, W. Stuetzle
|
2002
|
View Paper |
Interactively Exploring Hierarchical Clustering Results
|
Jinwook Seo, B. Shneiderman
|
2002
|
View Paper |
System and architecture-level power reduction of microprocessor-based communication and multi-media applications
|
L. Nachtergaele, Vivek Tiwari, N. Dutt
|
2000
|
View Paper |
Introduction to the special issue on interactive graphical data analysis: What is interaction?
|
Deborah F. Swayne, S. Klinke
|
1999
|
View Paper |
XGobi: Interactive Dynamic Data Visualization in the X Window System
|
Deborah F. Swayne, D. Cook, A. Buja
|
1998
|
View Paper |
Interactive Graphics for Data Sets with Missing Values—MANET
|
A. Unwin, G. Hawkins, H. Hofmann, Bernd Siegl
|
1996
|
View Paper |
Scatter/Gather: a cluster-based approach to browsing large document collections
|
D. Cutting, Jan O. Pedersen, David R Karger, J. Tukey
|
1992
|
View Paper |
‘Coronavirus (Covid-19) Data in the United States’
|
2021
|
||
covidcast: Client for Delphi’s COVIDcast API
|
2021
|
||
Safer at Home Level Orange
|
2021
|
||
‘Fall 2020 Framework’
|
2020
|
||
Ob14f-0437 -determining ecological provinces from optical cytometric data in the north pacific ocean
|
2020
|
||
Larimer County to Move to Safer at Home Level Red of Colorado's Dial
|
2020
|
||
palmerpenguins: Palmer Archipelago (Antarctica) penguin data
|
2020
|
||
Delphi Epidata API SafeGraph
|
2020
|
||
collapsibleTree: Interactive Collapsible Tree Diagrams using ‘D3.js’. R package version 0.1.7
|
2018
|
||
ASA Sections on: Statistical Computing Statistical Graphics
|
2018
|
||
protoclust: Hierarchical Clustering with Prototypes
|
2017
|
||
shiny: Web Application Framework for R. R package version 1.0.5
|
2017
|
||
animint: Interactive Animations. R package version 2017.01.04
|
2017
|
||
ggvis: Interactive Grammar of Graphics
|
2016
|
||
dynamicTreeCut: Methods for Detection of Clusters in Hierarchical Clustering Dendrograms. R package version 1.63-1
|
2016
|
||
R: A language and environment for statistical computing.
|
R. Team
|
2014
|
View Paper |
Census Regions and Divisions of the United States
|
2010
|
||
Data for MATLAB Hackers,
|
2008
|
||
Exploratory data analysis , Vol. 2
|
1977
|
||
The balance of Roger de piles: A statistical analysis
|
W. G. Studdert-Kennedy, M. Davenport
|
1974
|
View Paper |
c ○ 2000 Kluwer Academic Publishers. Manufactured in The Netherlands. The Earth Mover’s Distance as a Metric for Image Retrieval
|
View Paper | ||
Make dendrograms interactive
|
|||
Can we cluster US counties by residents’ behaviors—i.e.
|
|||
‘Coronavirus Resource Center’
|
Showing first page preview. Click "Open Full PDF" to view the complete paper.
Your comment contains inappropriate language and has been rejected.
Are you sure you want to remove this tag? This action cannot be undone.
Someone just favorited a paper!
Comments (0)