GuidelineExplorer -- Navigating through the Forrest of Actionable Guidelines on Node-Link Graph Visualization
Publication
Metrics
AI Quick Summary
**Summary:** This paper introduces GuidelineExplorer, a visual interactive system that collects and structures actionable guidelines for node-link graph visualizations, aiming to streamline the design process and facilitate collaboration among researchers by providing clear instructions for optimal graph layouts and appearances. The system also extends to matrix visualizations to demonstrate its general applicability.
Paper Preview
Abstract
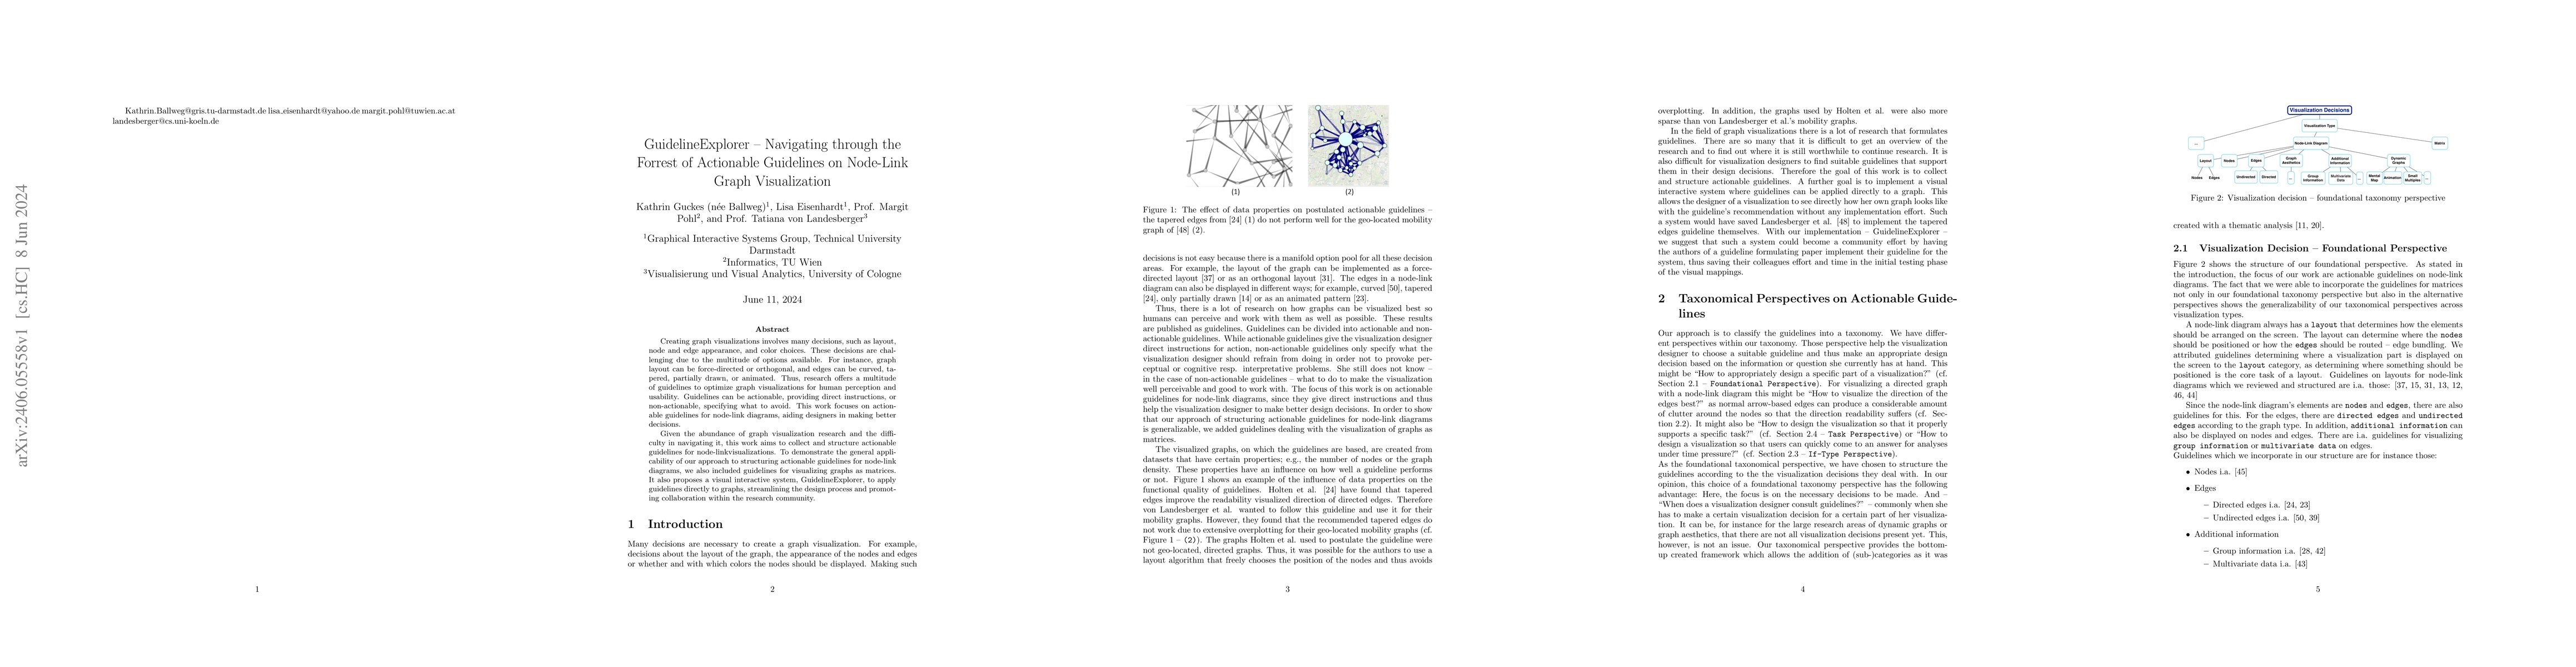
Creating graph visualizations involves many decisions, such as layout, node and edge appearance, and color choices. These decisions are challenging due to the multitude of options available. For instance, graph layout can be force-directed or orthogonal, and edges can be curved, tapered, partially drawn, or animated. Thus, research offers a multitude of guidelines to optimize graph visualizations for human perception and usability. Guidelines can be actionable, providing direct instructions, or non-actionable, specifying what to avoid. This work focuses on actionable guidelines for node-link diagrams, aiding designers in making better decisions. Given the abundance of graph visualization research and the difficulty in navigating it, this work aims to collect and structure actionable guidelines for node-linkvisualizations. To demonstrate the general applicability of our approach to structuring actionable guidelines for node-link diagrams, we also included guidelines for visualizing graphs as matrices. It also proposes a visual interactive system, GuidelineExplorer, to apply guidelines directly to graphs, streamlining the design process and promoting collaboration within the research community.
AI Key Findings
Get AI-generated insights about this paper's methodology, results, significance, and more — seven facets brought into focus.
Impact
Paper Details
Authors
PDF Preview
Key Terms
Citation Network
Current paper (gray), citations (green), references (blue)
Display is limited for performance on very large graphs.
Discussion 0