Implied and Realized Volatility: A Study of the Ratio Distribution
Publication
Metrics
AI Quick Summary
This study investigates the correlation between VIX and VXO indices and realized variances, demonstrating that the ratio distribution of implied volatility to realized variance is best modeled by a Beta Prime distribution, with shape parameters varying based on the month considered.
Paper Preview
Abstract
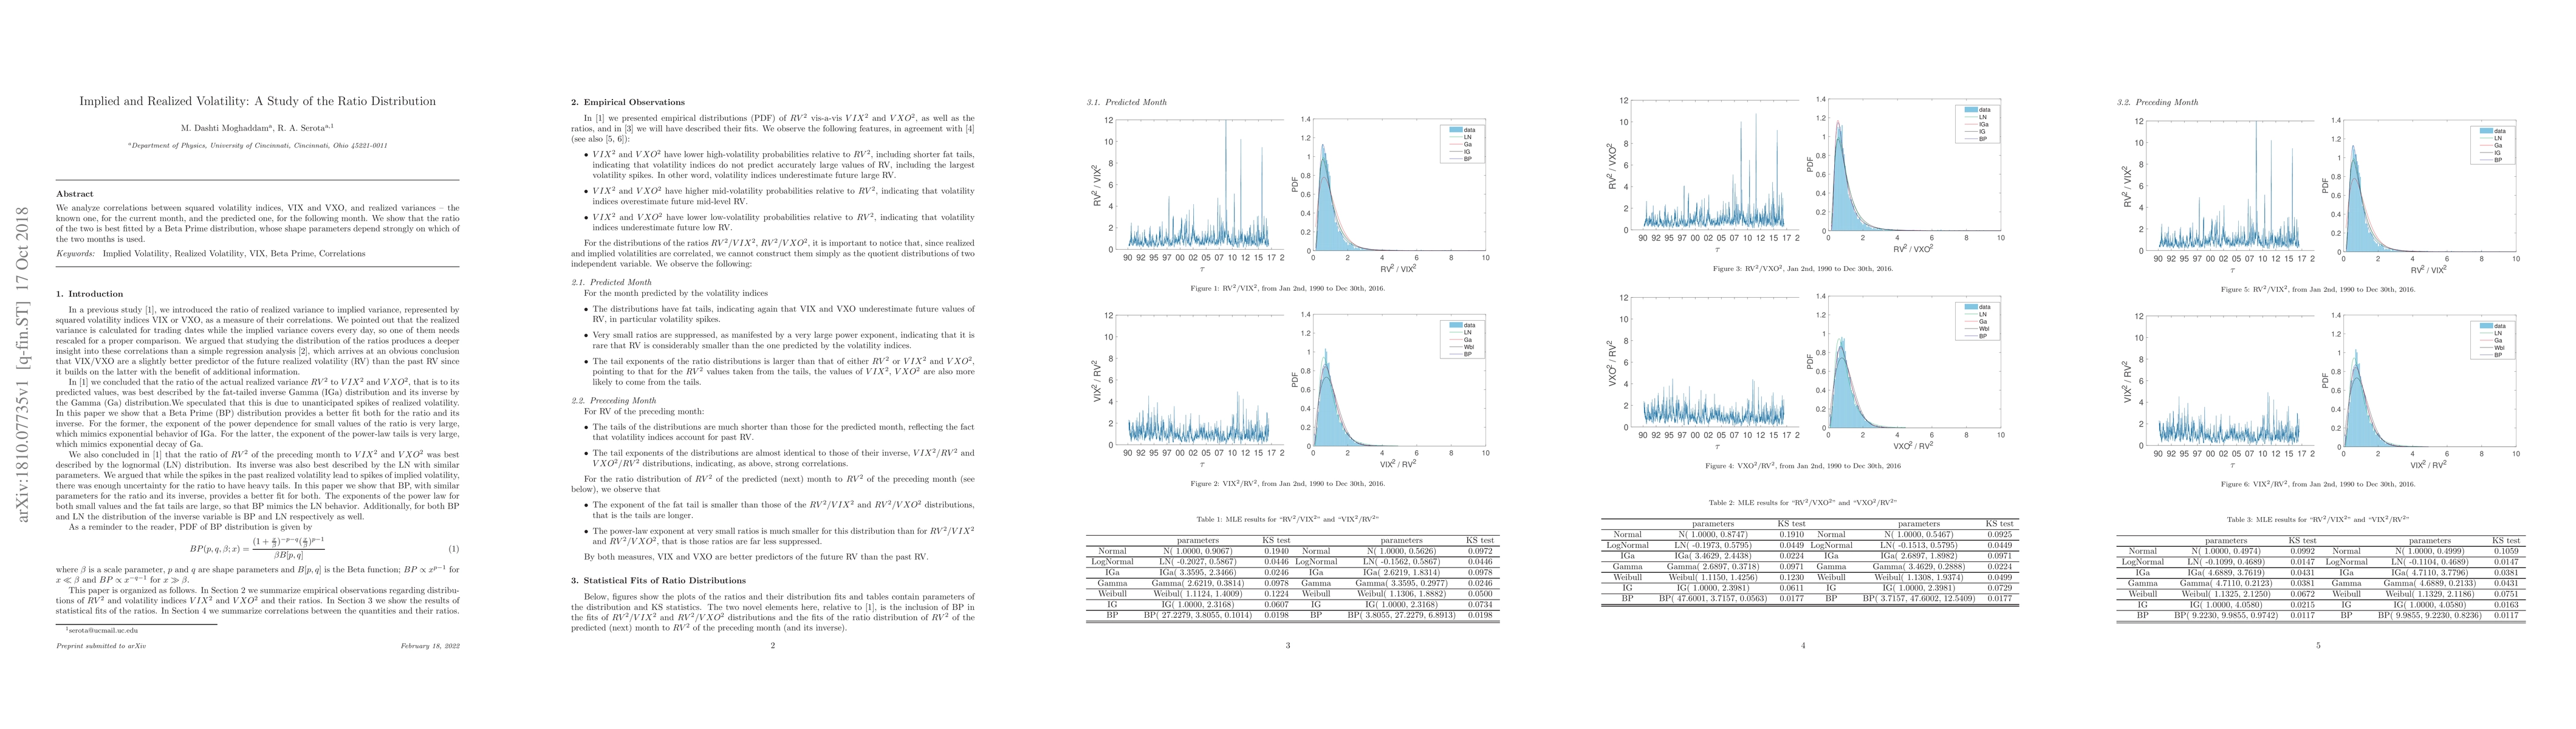
We analyze correlations between squared volatility indices, VIX and VXO, and realized variances -- the known one, for the current month, and the predicted one, for the following month. We show that the ratio of the two is best fitted by a Beta Prime distribution, whose shape parameters depend strongly on which of the two months is used.
AI Key Findings
Get AI-generated insights about this paper's methodology, results, significance, and more — seven facets brought into focus.
Impact
Paper Details
PDF Preview
Key Terms
Citation Network
Current paper (gray), citations (green), references (blue)
Display is limited for performance on very large graphs.
Discussion 0