Summary
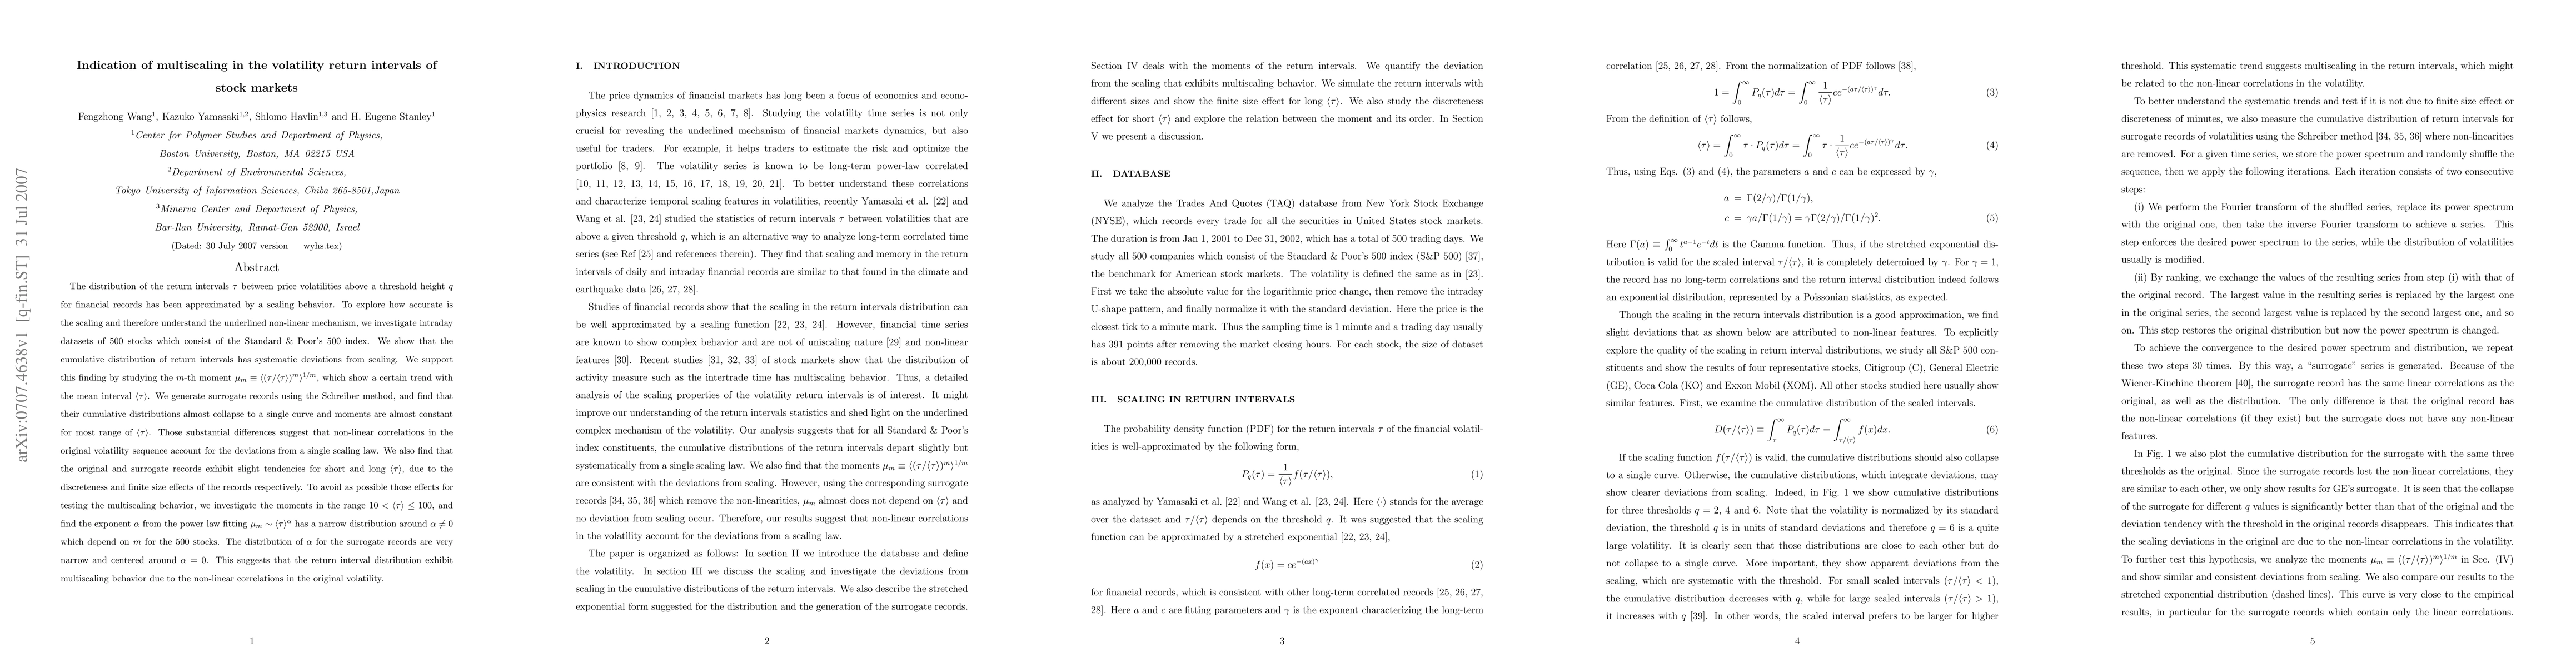
The distribution of the return intervals $\tau$ between volatilities above a threshold $q$ for financial records has been approximated by a scaling behavior. To explore how accurate is the scaling and therefore understand the underlined non-linear mechanism, we investigate intraday datasets of 500 stocks which consist of the Standard & Poor's 500 index. We show that the cumulative distribution of return intervals has systematic deviations from scaling. We support this finding by studying the m-th moment $\mu_m \equiv <(\tau/<\tau>)^m>^{1/m}$, which show a certain trend with the mean interval $<\tau>$. We generate surrogate records using the Schreiber method, and find that their cumulative distributions almost collapse to a single curve and moments are almost constant for most range of $<\tau>$. Those substantial differences suggest that non-linear correlations in the original volatility sequence account for the deviations from a single scaling law. We also find that the original and surrogate records exhibit slight tendencies for short and long $<\tau>$, due to the discreteness and finite size effects of the records respectively. To avoid as possible those effects for testing the multiscaling behavior, we investigate the moments in the range $10<<\tau>\leq100$, and find the exponent $\alpha$ from the power law fitting $\mu_m\sim<\tau>^\alpha$ has a narrow distribution around $\alpha\neq0$ which depend on m for the 500 stocks. The distribution of $\alpha$ for the surrogate records are very narrow and centered around $\alpha=0$. This suggests that the return interval distribution exhibit multiscaling behavior due to the non-linear correlations in the original volatility.
AI Key Findings
Get AI-generated insights about this paper's methodology, results, and significance.
Paper Details
PDF Preview
Key Terms
Citation Network
Current paper (gray), citations (green), references (blue)
Display is limited for performance on very large graphs.
Similar Papers
Found 4 papers| Title | Authors | Year | Actions |
|---|
Comments (0)