LineCap: Line Charts for Data Visualization Captioning Models
Publication
Metrics
AI Quick Summary
LineCap introduces a new dataset for figure captioning, specifically for line charts, to aid in data visualization understanding, especially for visually impaired individuals. The paper also explores the application of deep learning models for automated figure captioning, highlighting the challenges and insights from dataset curation.
Paper Preview
Abstract
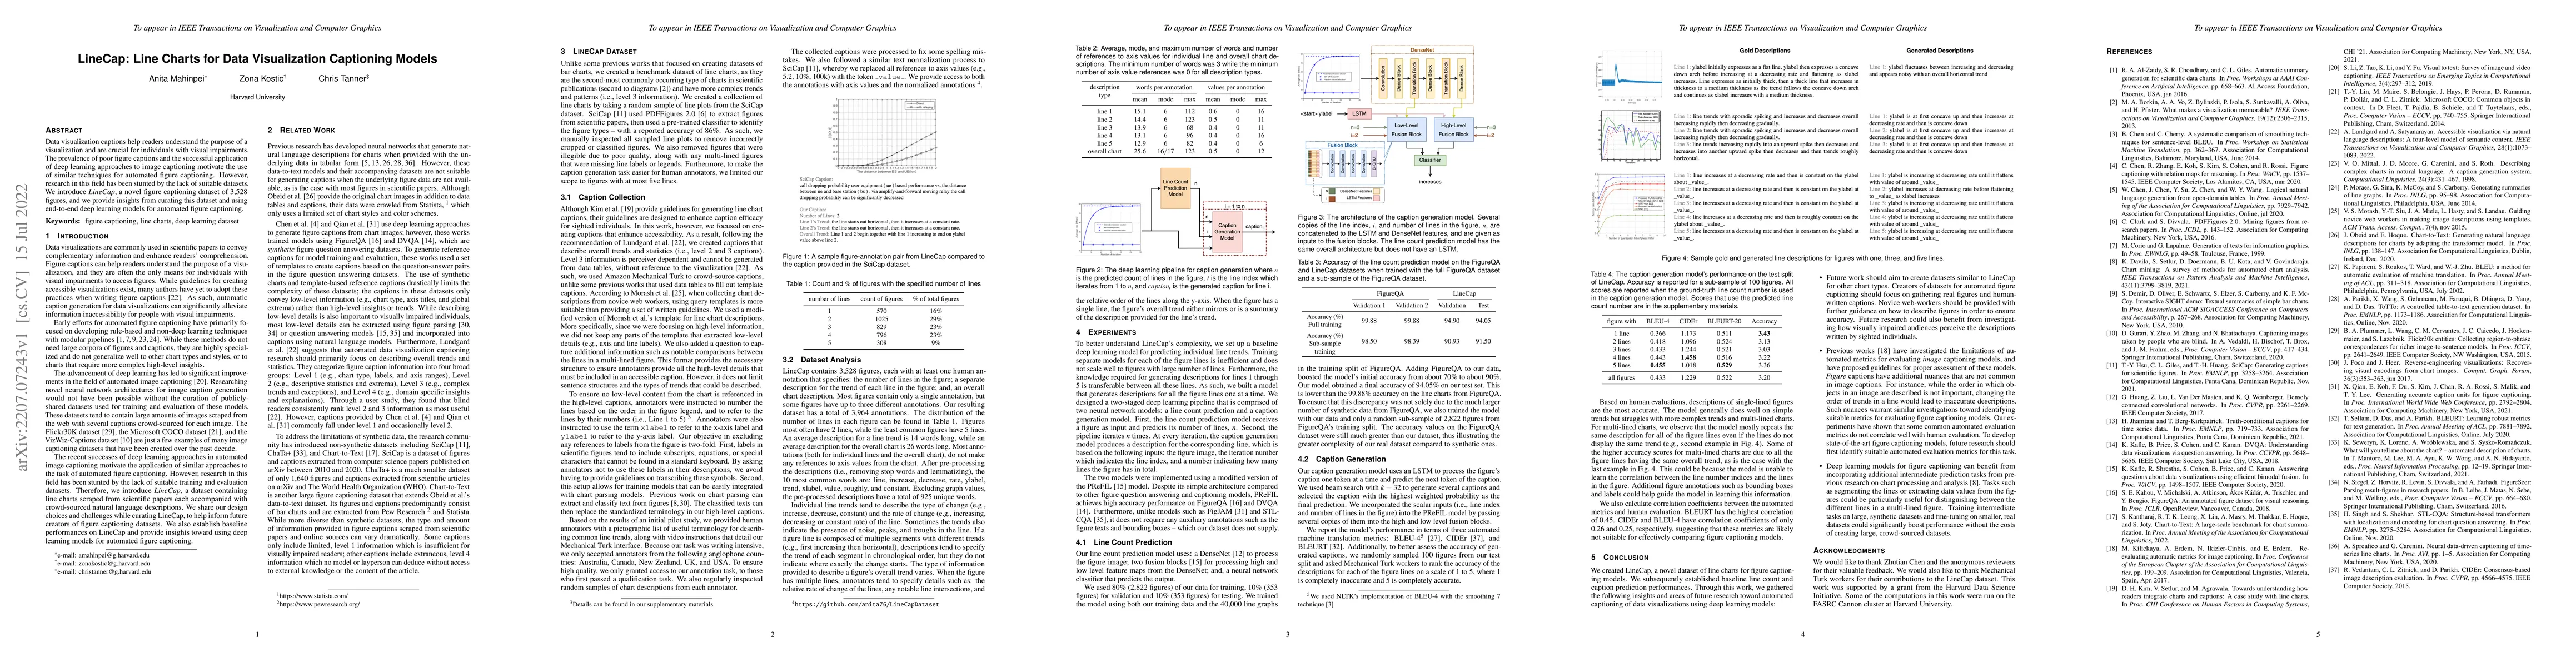
Data visualization captions help readers understand the purpose of a visualization and are crucial for individuals with visual impairments. The prevalence of poor figure captions and the successful application of deep learning approaches to image captioning motivate the use of similar techniques for automated figure captioning. However, research in this field has been stunted by the lack of suitable datasets. We introduce LineCap, a novel figure captioning dataset of 3,528 figures, and we provide insights from curating this dataset and using end-to-end deep learning models for automated figure captioning.
AI Key Findings
Get AI-generated insights about this paper's methodology, results, significance, and more — seven facets brought into focus.
Impact
Paper Details
Authors
PDF Preview
Key Terms
Citation Network
Current paper (gray), citations (green), references (blue)
Display is limited for performance on very large graphs.
Discussion 0