Machine Learning Visualization Tool for Exploring Parameterized Hydrodynamics
Publication
Metrics
AI Quick Summary
This paper introduces an interactive machine learning visualization tool designed to explore large datasets from parameterized hydrodynamic simulations, enabling scientists to visualize complex scenarios, perform sensitivity analyses, and optimize experiments. The tool compresses and interpolates $\mathcal{O}\left({\rm TB}\right)$ of simulation data for efficient exploration.
Paper Preview
Abstract
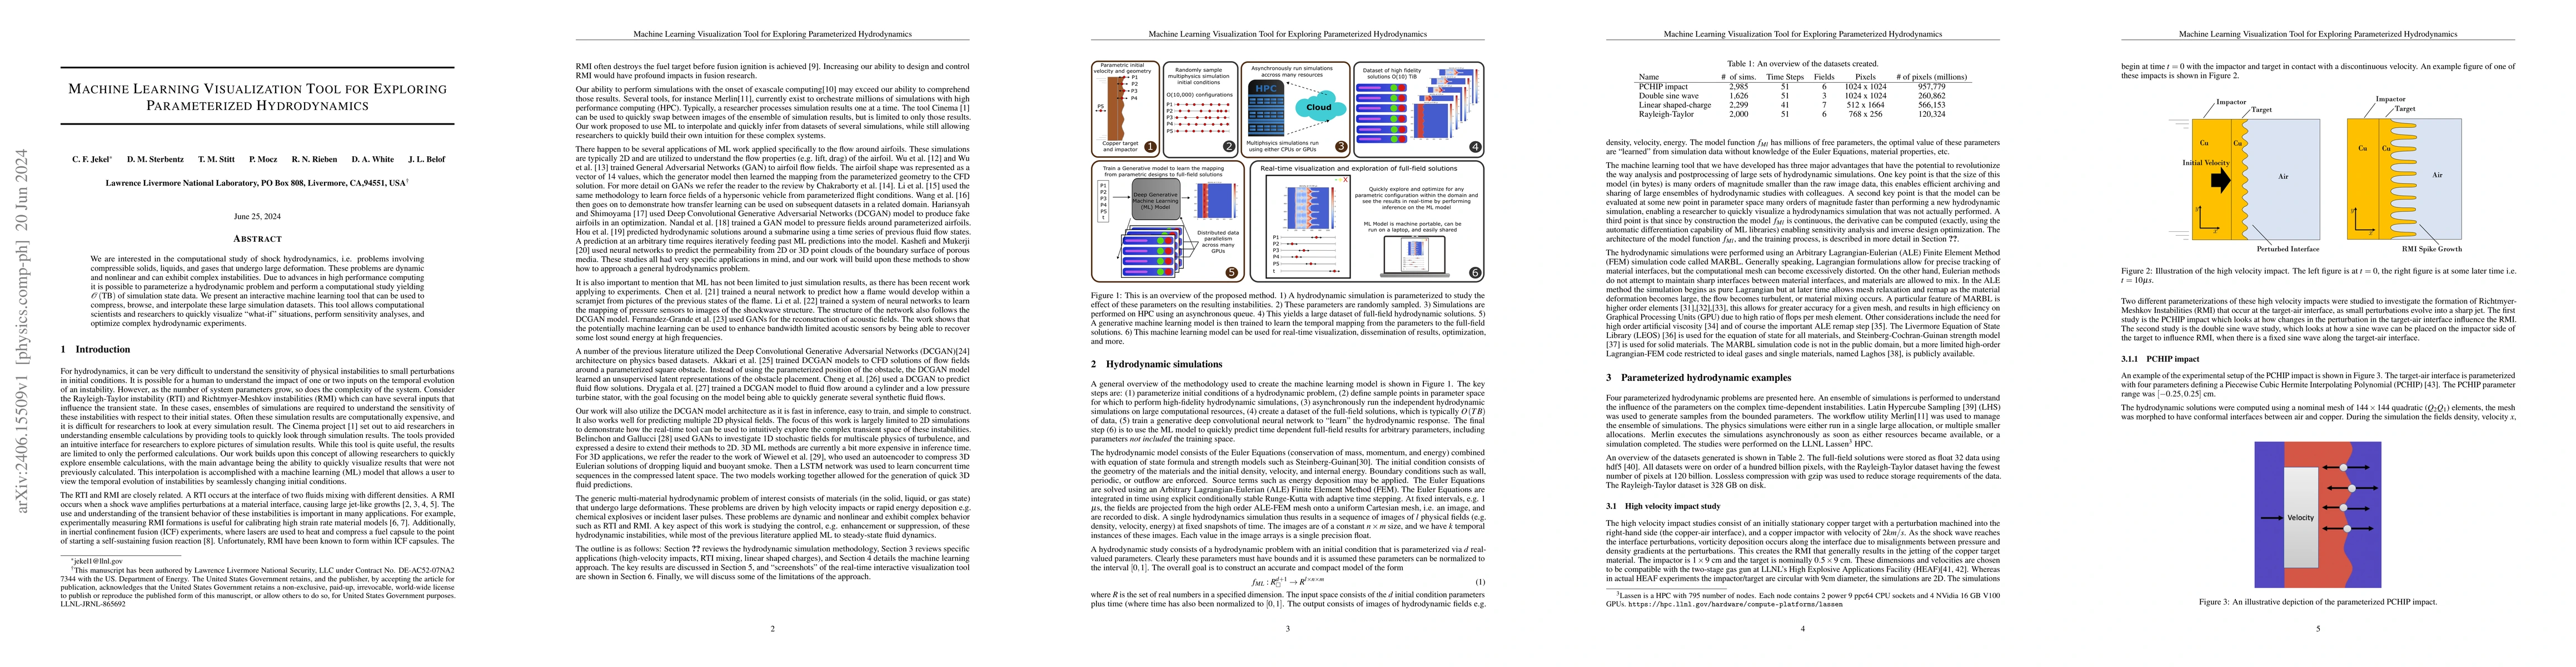
We are interested in the computational study of shock hydrodynamics, i.e. problems involving compressible solids, liquids, and gases that undergo large deformation. These problems are dynamic and nonlinear and can exhibit complex instabilities. Due to advances in high performance computing it is possible to parameterize a hydrodynamic problem and perform a computational study yielding $\mathcal{O}\left({\rm TB}\right)$ of simulation state data. We present an interactive machine learning tool that can be used to compress, browse, and interpolate these large simulation datasets. This tool allows computational scientists and researchers to quickly visualize "what-if" situations, perform sensitivity analyses, and optimize complex hydrodynamic experiments.
AI Key Findings
Get AI-generated insights about this paper's methodology, results, significance, and more — seven facets brought into focus.
Impact
Paper Details
Authors
PDF Preview
Key Terms
Citation Network
Current paper (gray), citations (green), references (blue)
Display is limited for performance on very large graphs.
Discussion 0