MTS2Graph: Interpretable Multivariate Time Series Classification with Temporal Evolving Graphs
Publication
Metrics
AI Quick Summary
The paper introduces MTS2Graph, a framework for interpreting multivariate time series classification using temporal evolving graphs. It leverages CNNs to extract representative patterns and constructs interpretable graphs to capture temporal relationships, enhancing model transparency while maintaining classification performance.
Paper Preview
Abstract
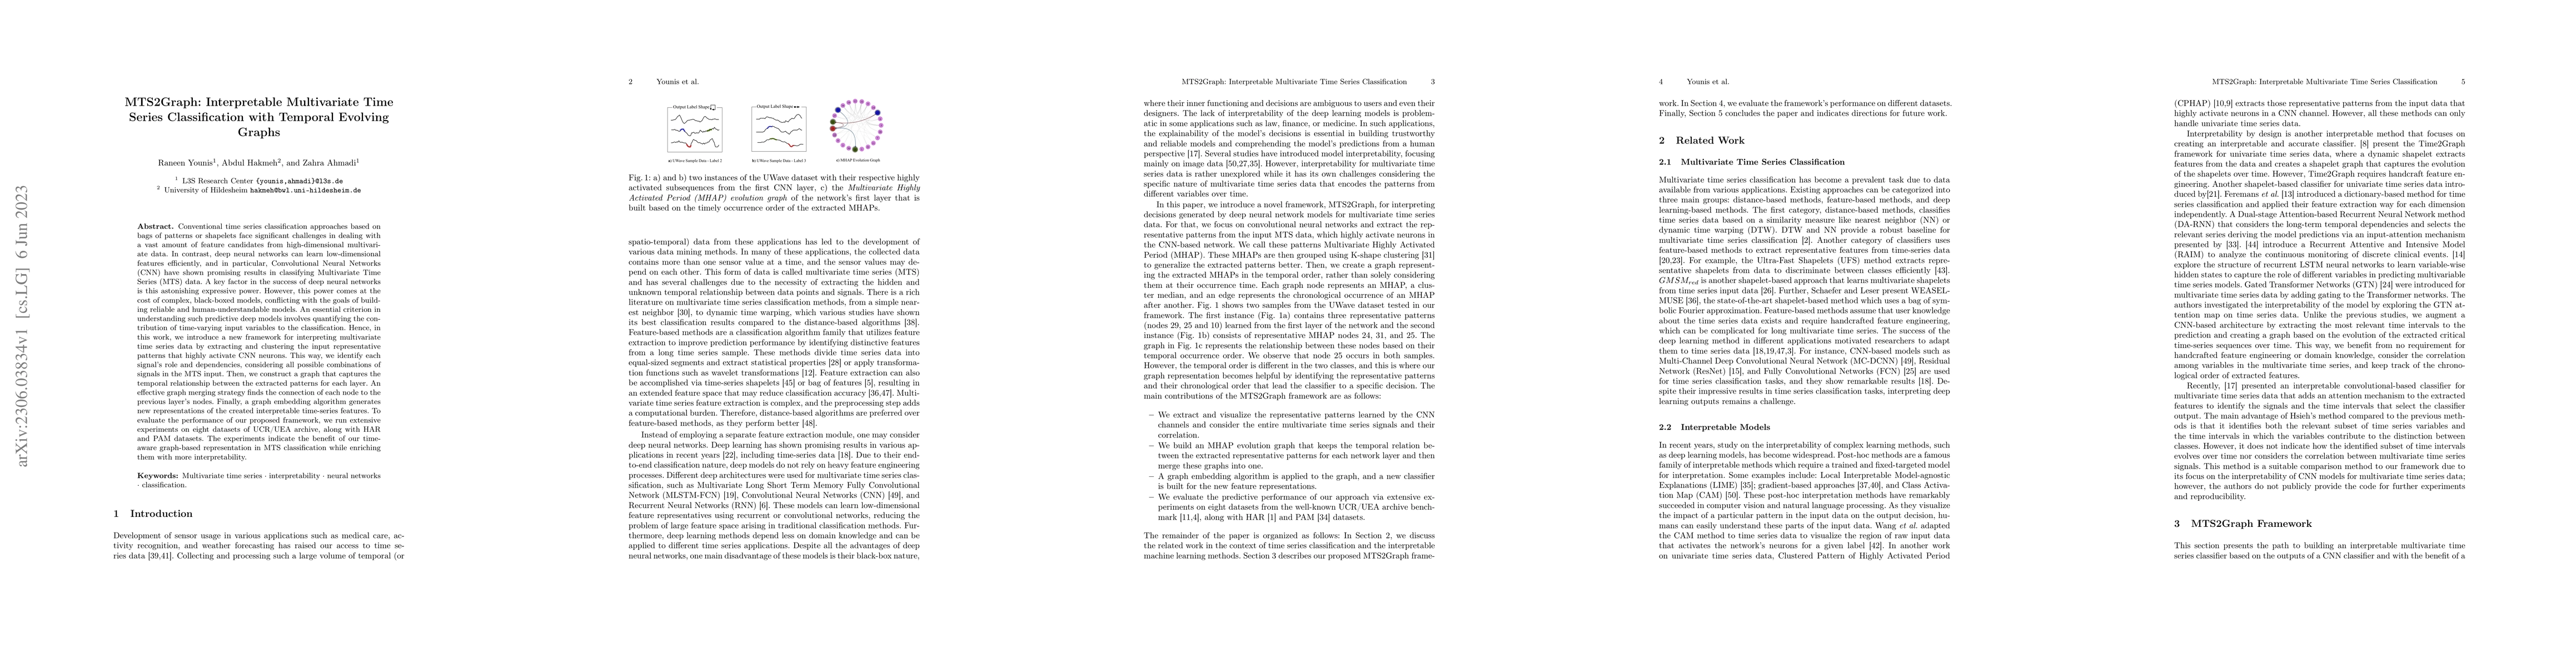
Conventional time series classification approaches based on bags of patterns or shapelets face significant challenges in dealing with a vast amount of feature candidates from high-dimensional multivariate data. In contrast, deep neural networks can learn low-dimensional features efficiently, and in particular, Convolutional Neural Networks (CNN) have shown promising results in classifying Multivariate Time Series (MTS) data. A key factor in the success of deep neural networks is this astonishing expressive power. However, this power comes at the cost of complex, black-boxed models, conflicting with the goals of building reliable and human-understandable models. An essential criterion in understanding such predictive deep models involves quantifying the contribution of time-varying input variables to the classification. Hence, in this work, we introduce a new framework for interpreting multivariate time series data by extracting and clustering the input representative patterns that highly activate CNN neurons. This way, we identify each signal's role and dependencies, considering all possible combinations of signals in the MTS input. Then, we construct a graph that captures the temporal relationship between the extracted patterns for each layer. An effective graph merging strategy finds the connection of each node to the previous layer's nodes. Finally, a graph embedding algorithm generates new representations of the created interpretable time-series features. To evaluate the performance of our proposed framework, we run extensive experiments on eight datasets of the UCR/UEA archive, along with HAR and PAM datasets. The experiments indicate the benefit of our time-aware graph-based representation in MTS classification while enriching them with more interpretability.
AI Key Findings
Get AI-generated insights about this paper's methodology, results, significance, and more — seven facets brought into focus.
Impact
Paper Details
Authors
PDF Preview
Key Terms
Citation Network
Current paper (gray), citations (green), references (blue)
Display is limited for performance on very large graphs.
Discussion 0