MultiSegVA: Using Visual Analytics to Segment Biologging Time Series on Multiple Scales
Publication
Metrics
AI Quick Summary
MultiSegVA is a visual analytics platform designed to facilitate the segmentation of biologging time series data across multiple temporal scales. It offers interactive tools and visual query language to support complex segmentation techniques, demonstrating effectiveness in movement ecology and generalizability to other domains.
Paper Preview
Abstract
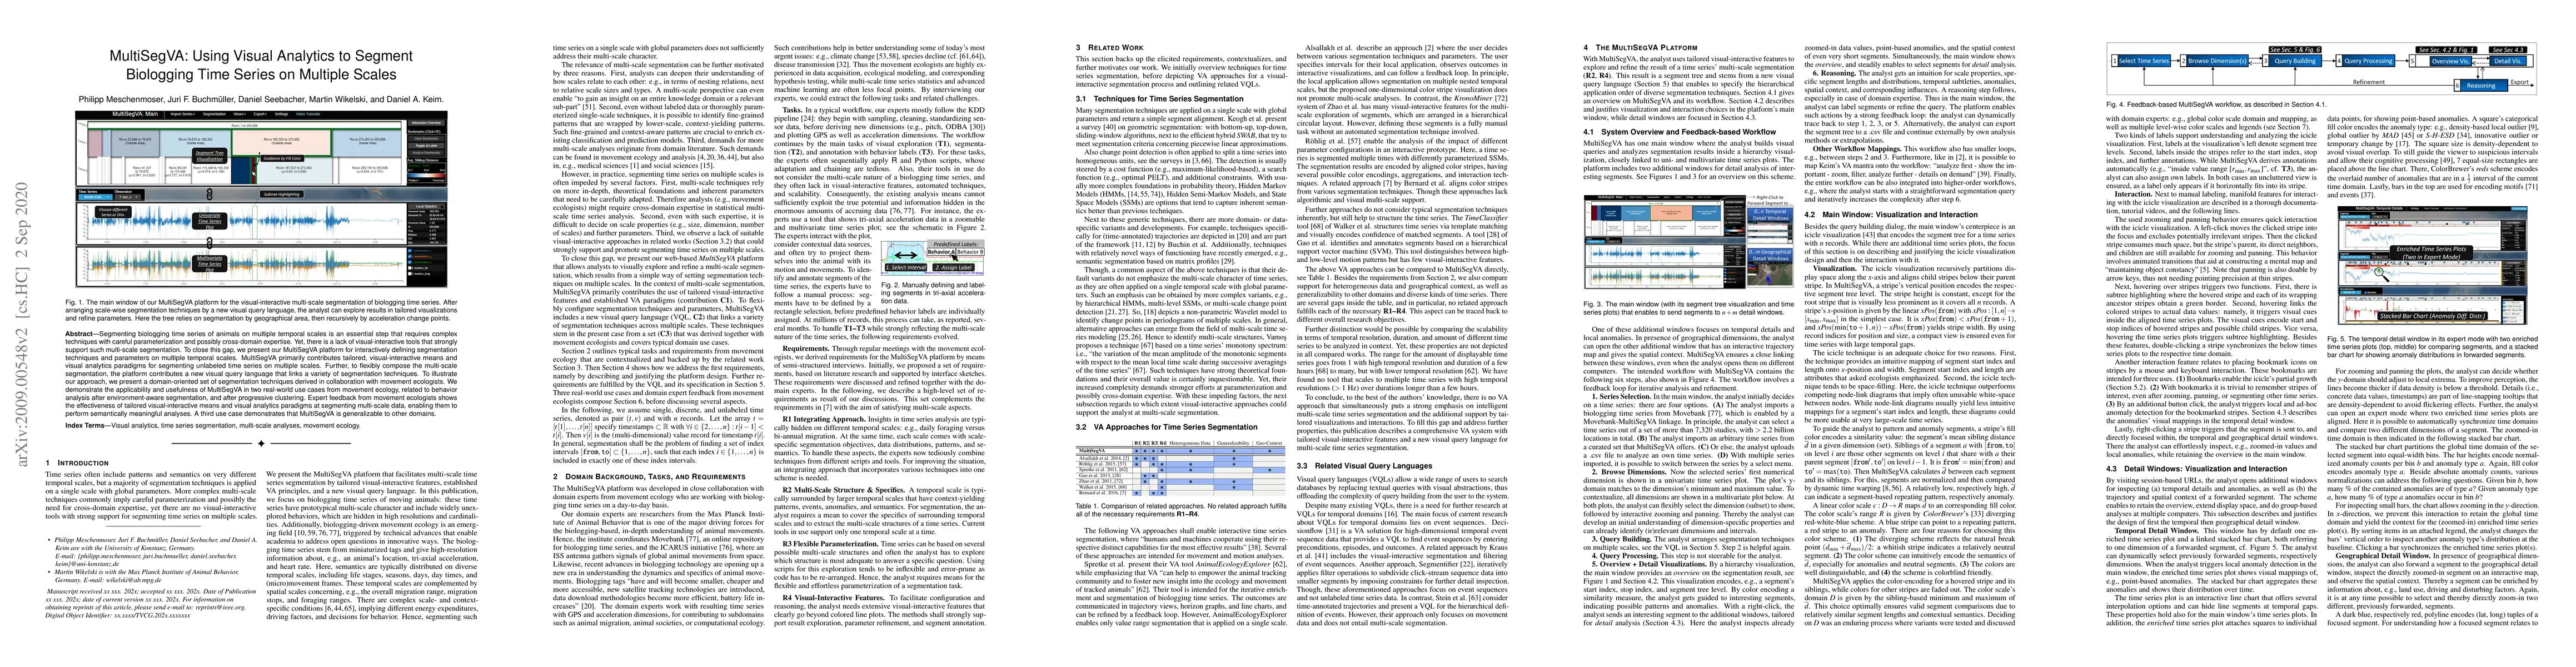
Segmenting biologging time series of animals on multiple temporal scales is an essential step that requires complex techniques with careful parameterization and possibly cross-domain expertise. Yet, there is a lack of visual-interactive tools that strongly support such multi-scale segmentation. To close this gap, we present our MultiSegVA platform for interactively defining segmentation techniques and parameters on multiple temporal scales. MultiSegVA primarily contributes tailored, visual-interactive means and visual analytics paradigms for segmenting unlabeled time series on multiple scales. Further, to flexibly compose the multi-scale segmentation, the platform contributes a new visual query language that links a variety of segmentation techniques. To illustrate our approach, we present a domain-oriented set of segmentation techniques derived in collaboration with movement ecologists. We demonstrate the applicability and usefulness of MultiSegVA in two real-world use cases from movement ecology, related to behavior analysis after environment-aware segmentation, and after progressive clustering. Expert feedback from movement ecologists shows the effectiveness of tailored visual-interactive means and visual analytics paradigms at segmenting multi-scale data, enabling them to perform semantically meaningful analyses. A third use case demonstrates that MultiSegVA is generalizable to other domains.
AI Key Findings
Get AI-generated insights about this paper's methodology, results, significance, and more — seven facets brought into focus.
Impact
Paper Details
PDF Preview
Key Terms
Citation Network
Current paper (gray), citations (green), references (blue)
Display is limited for performance on very large graphs.
Discussion 0