Quick Summary:

Plotly-Resampler is an open-source Python library designed to enhance the scalability and interactivity of time series visualizations in Plotly, enabling effective visual analytics for large datasets. It aggregates data dynamically based on the current graph view, offering high configurability and scalability to millions of data points.

Summary

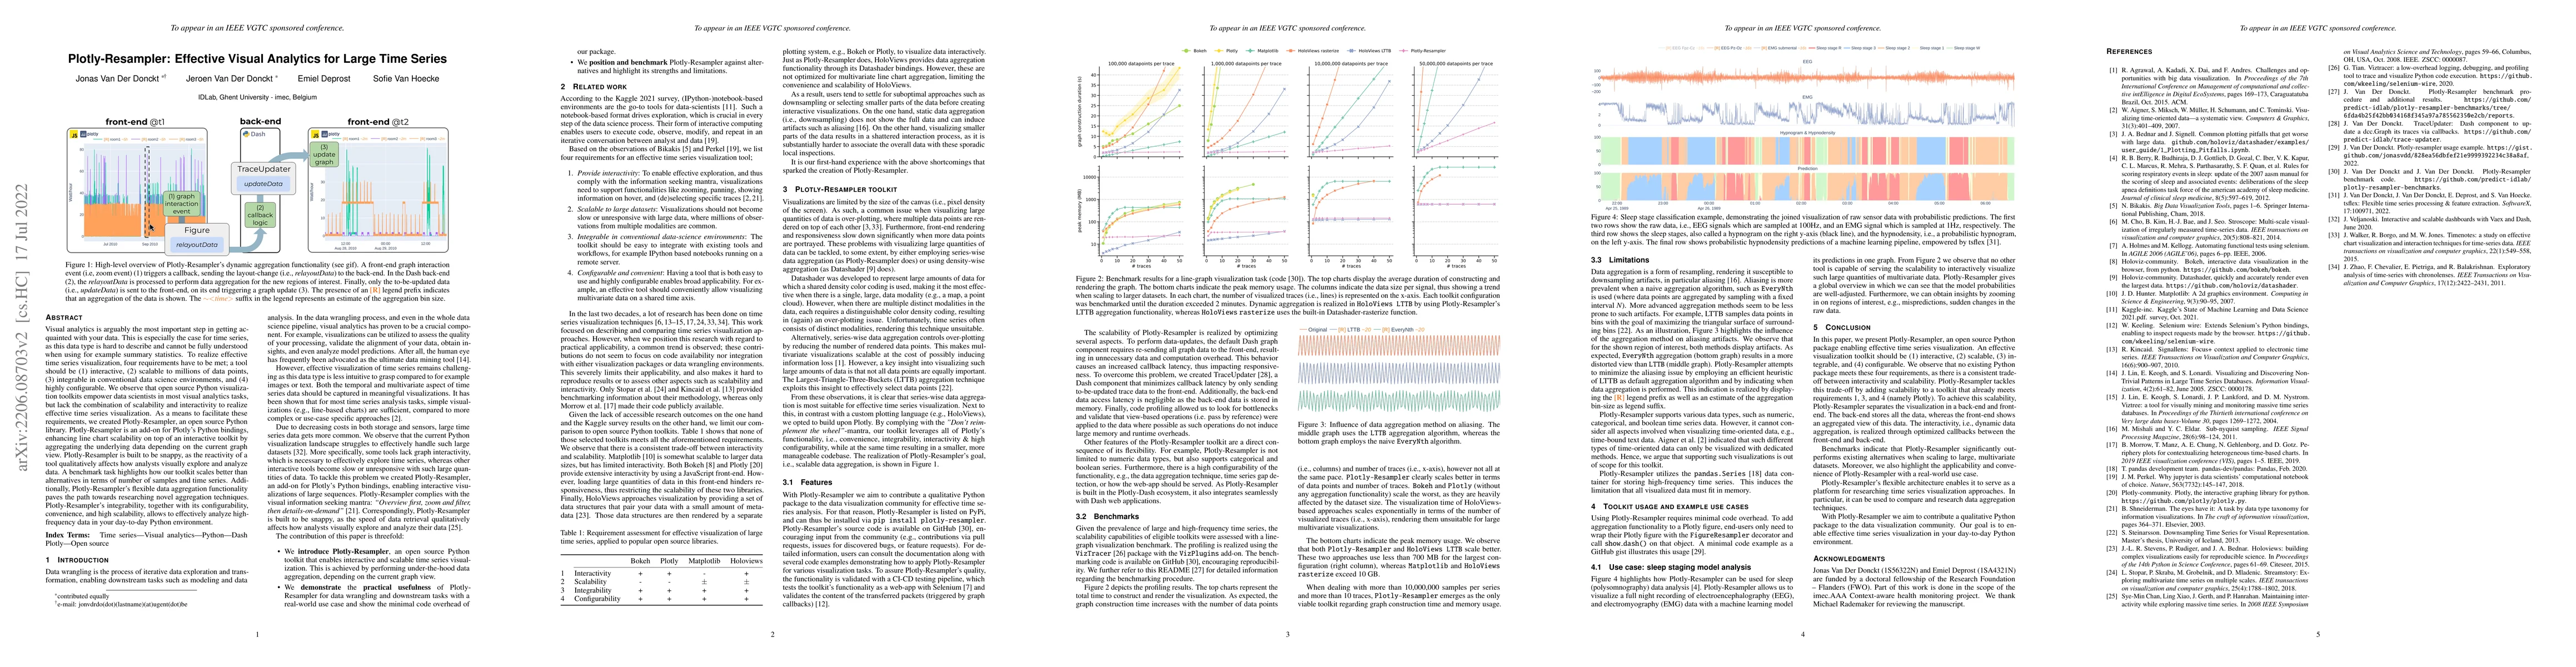
Visual analytics is arguably the most important step in getting acquainted with your data. This is especially the case for time series, as this data type is hard to describe and cannot be fully understood when using for example summary statistics. To realize effective time series visualization, four requirements have to be met; a tool should be (1) interactive, (2) scalable to millions of data points, (3) integrable in conventional data science environments, and (4) highly configurable. We observe that open source Python visualization toolkits empower data scientists in most visual analytics tasks, but lack the combination of scalability and interactivity to realize effective time series visualization. As a means to facilitate these requirements, we created Plotly-Resampler, an open source Python library. Plotly-Resampler is an add-on for Plotly's Python bindings, enhancing line chart scalability on top of an interactive toolkit by aggregating the underlying data depending on the current graph view. Plotly-Resampler is built to be snappy, as the reactivity of a tool qualitatively affects how analysts visually explore and analyze data. A benchmark task highlights how our toolkit scales better than alternatives in terms of number of samples and time series. Additionally, Plotly-Resampler's flexible data aggregation functionality paves the path towards researching novel aggregation techniques. Plotly-Resampler's integrability, together with its configurability, convenience, and high scalability, allows to effectively analyze high-frequency data in your day-to-day Python environment.

AI Key Findings

Get AI-generated insights about this paper's methodology, results, and significance.

Paper Details

PDF Preview

Download PDF

Key Terms

python (0.284)
time series (0.252)
visualization (0.250)
time series (0.241)
scalability (0.220)
scalability (0.220)
interactive (0.206)
interactive (0.199)
aggregation (0.193)
series (0.191)
aggregation (0.190)
series (0.189)
realize (0.181)
open source (0.179)
day (0.178)
realize (0.178)
day (0.177)
open source (0.175)
requirements (0.169)
requirements (0.160)

Citation Network

Current paper (gray), citations (green), references (blue)

Current Paper
Citations
References
Click to view
Title Authors Year Actions
LIVE-ITS: LSH-based Interactive Visualization Explorer for Large-Scale Incomplete Time Series
Hongjie Chen, Aaron D. Beachnau, Panos Thomas, Pranav Maneriker, Josh Kimball, Ryan A. Rossi
2024
View Paper
Visualizing Mimicry in Agile Teams: A Multimodal Approach
Adrian Fernández Canino, Fernando Vargas, Diego Miranda, Dayana Palma, René Noël, C. Cechinel, R. Muñoz
2024
View Paper
FPCS: Feature Preserving Compensated Sampling of Streaming Time Series Data
Hongyan Li, Bo Yang, Yansong Chua
2024
View Paper
Mitigating data quality challenges in ambulatory wrist-worn wearable monitoring through analytical and practical approaches
Jonas Van Der Donckt, N. Vandenbussche, Jeroen Van Der Donckt, Stephanie Chen, Marija Stojchevska, Mathias De Brouwer, Bram Steenwinckel, Koen Paemeleire, F. Ongenae, Sofie Van Hoecke
2024
View Paper
Magnitude and Rotation Invariant Detection of Transportation Modes with Missing Data Modalities
Jeroen Van Der Donckt, Jonas Van Der Donckt, S. V. Hoecke
2024
View Paper
Time Series Representation for Visualization in Apache IoTDB
Lei Rui, Xiangdong Huang, Shaoxu Song, Yuyuan Kang, Chen Wang, Jianmin Wang
2024
View Paper
Addressing Data Quality Challenges in Observational Ambulatory Studies: Analysis, Methodologies and Practical Solutions for Wrist-worn Wearable Monitoring
Jonas Van Der Donckt, N. Vandenbussche, Jeroen Van Der Donckt, Stephanie Chen, Marija Stojchevska, Mathias De Brouwer, Bram Steenwinckel, Koen Paemeleire, F. Ongenae, S. V. Hoecke
2024
View Paper
shinyHugePlot: An R package for displaying the features of data with a huge sample size
Junta Tagusari
2023
View Paper
Patients with chronic cluster headache may show reduced activity energy expenditure on ambulatory wrist actigraphy recordings during daytime attacks
N. Vandenbussche, Jonas Van Der Donckt, Mathias De Brouwer, Bram Steenwinckel, Marija Stojchevska, F. Ongenae, Sofie Van Hoecke, Koen Paemeleire
2023
View Paper
Investigating customer churn in banking: A machine learning approach and visualization app for data science and management
Pahul Preet Singh, Fahim Islam Anik, Rahul Senapati, Arnav Sinha, Nazmus Sakib, Eklas Hossain
2023
View Paper
Tsdownsample: High-performance Time Series Downsampling for Scalable Visualization
Jeroen Van Der Donckt, Jonas Van Der Donckt, Sofie Van Hoecke
2023
View Paper
A electricity theft detection method through contrastive learning in smart grid
Zijian Liu, Weilong Ding, Tao Chen, Maoxiang Sun, Hongmin Cai, Chen Liu
2023
View Paper
SuperNOVA: Design Strategies and Opportunities for Interactive Visualization in Computational Notebooks
Zijie J. Wang, David Munechika, Seongmin Lee, Duen Horng Chau
2023
View Paper
MinMaxLTTB: Leveraging MinMax-Preselection to Scale LTTB
Jeroen Van Der Donckt, Jonas Van Der Donckt, Michael Rademaker, S. V. Hoecke
2023
View Paper
Data Point Selection for Line Chart Visualization: Methodological Assessment and Evidence-Based Guidelines
Jonas Van Der Donckt, Jeroen Van Der Donckt, Michael Rademaker, S. V. Hoecke
2023
View Paper
Do not sleep on traditional machine learning: Simple and interpretable techniques are competitive to deep learning for sleep scoring
Jeroen Van Der Donckt, Jonas Van Der Donckt, Emiel Deprost, N. Vandenbussche, Michael Rademaker, Gilles Vandewiele, S. Van Hoecke
2022
View Paper
Do Not Sleep on Linear Models (cid:63) Simple and Interpretable Techniques Outperform Deep Learning for Sleep Scoring
Jeroen Van Der Donckt, Jonas Van Der Donckt, Emiel Deprost, Michael Rademaker, Gilles Vandewiele, S. V. Hoecke
View Paper
ScholarWorks ScholarWorks
Pahul Preet Singh, Fahim Islam Anik, Rahul Senapati, Arnav Sinha, Nazmus Sakib, Islam Anik, Eklas Hossain
View Paper
Do Not Sleep on Linear Models (cid:63) Simple and Interpretable Techniques Outperform Deep Learning for Sleep Scoring
Jeroen Van, Der Donckt, Jonas Van Der Donckt, Emiel Deprost, Michael Rademaker, Gilles Vandewiele, S. V. Hoecke
View Paper

Comments (0)

This website uses cookies to ensure you get the best experience. Learn more