Authors
Summary
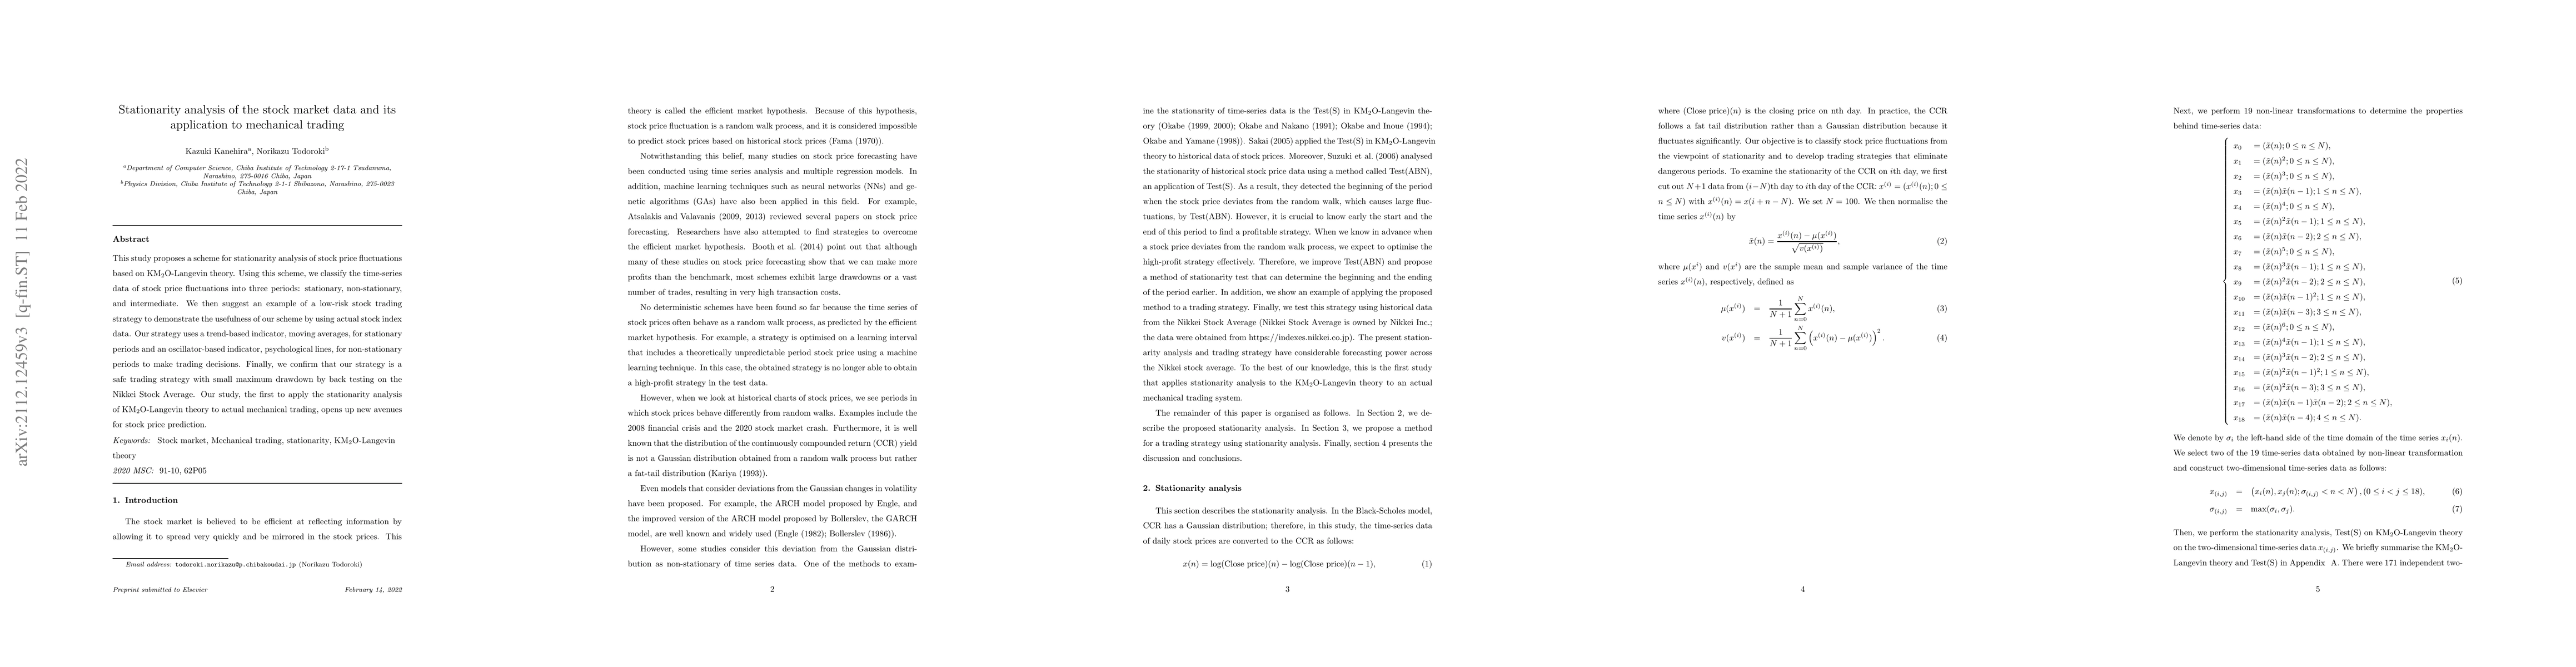
This study proposes a scheme for stationarity analysis of stock price fluctuations based on KM$_2$O-Langevin theory. Using this scheme, we classify the time-series data of stock price fluctuations into three periods: stationary, non-stationary, and intermediate. We then suggest an example of a low-risk stock trading strategy to demonstrate the usefulness of our scheme by using actual stock index data. Our strategy uses a trend-based indicator, moving averages, for stationary periods and an oscillator-based indicator, psychological lines, for non-stationary periods to make trading decisions. Finally, we confirm that our strategy is a safe trading strategy with small maximum drawdown by back testing on the Nikkei Stock Average. Our study, the first to apply the stationarity analysis of KM$_2$O-Langevin theory to actual mechanical trading, opens up new avenues for stock price prediction.
AI Key Findings
Get AI-generated insights about this paper's methodology, results, and significance.
Paper Details
PDF Preview
Key Terms
Citation Network
Current paper (gray), citations (green), references (blue)
Display is limited for performance on very large graphs.
Similar Papers
Found 4 papersDeep Reinforcement Learning Approach for Trading Automation in The Stock Market
Ekrem Duman, Taylan Kabbani
| Title | Authors | Year | Actions |
|---|
Comments (0)