Stock Market Visualization
Publication
Metrics
Paper Preview
Abstract
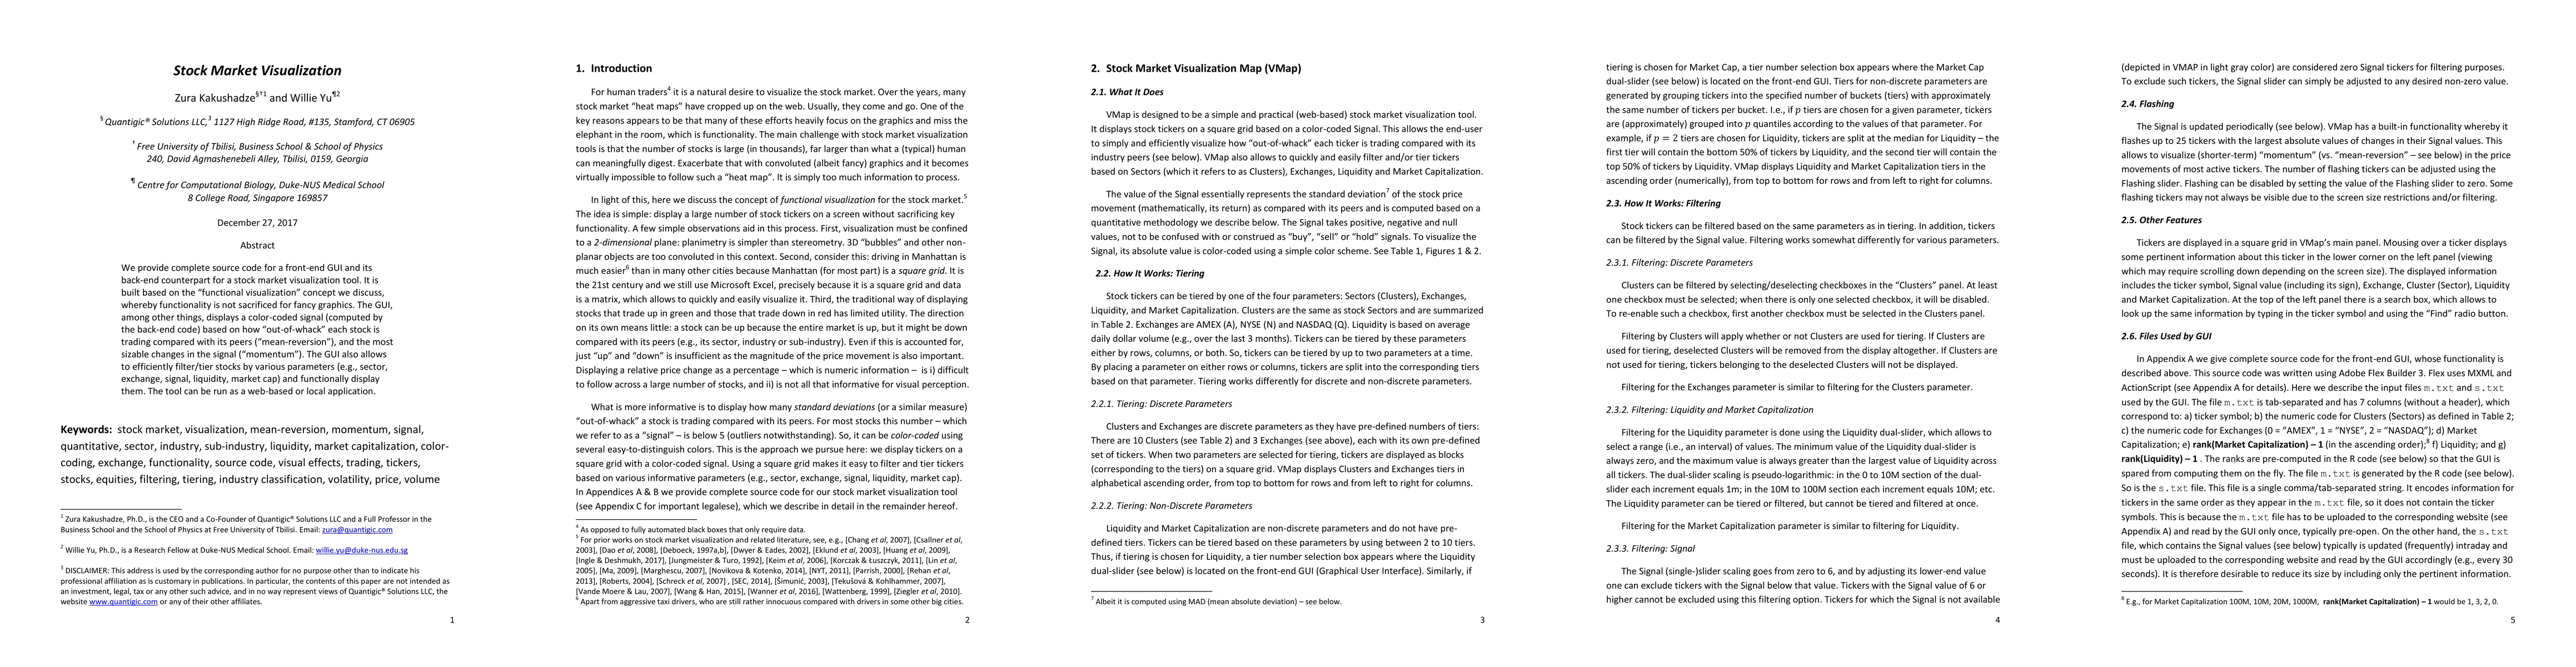
We provide complete source code for a front-end GUI and its back-end counterpart for a stock market visualization tool. It is built based on the "functional visualization" concept we discuss, whereby functionality is not sacrificed for fancy graphics. The GUI, among other things, displays a color-coded signal (computed by the back-end code) based on how "out-of-whack" each stock is trading compared with its peers ("mean-reversion"), and the most sizable changes in the signal ("momentum"). The GUI also allows to efficiently filter/tier stocks by various parameters (e.g., sector, exchange, signal, liquidity, market cap) and functionally display them. The tool can be run as a web-based or local application.
AI Key Findings
Get AI-generated insights about this paper's methodology, results, significance, and more — seven facets brought into focus.
Impact
Paper Details
PDF Preview
Key Terms
Citation Network
Current paper (gray), citations (green), references (blue)
Display is limited for performance on very large graphs.
Discussion 0