This paper proposes a synthetic data generation strategy to identify and extract icons from infographics, using a combination of training data from a dataset and Internet-scraped icons. The method achieves significantly higher precision and recall compared to models trained on natural images, and it enables the development of a multi-modal summarization application that generates textual and visual summaries of infographics.
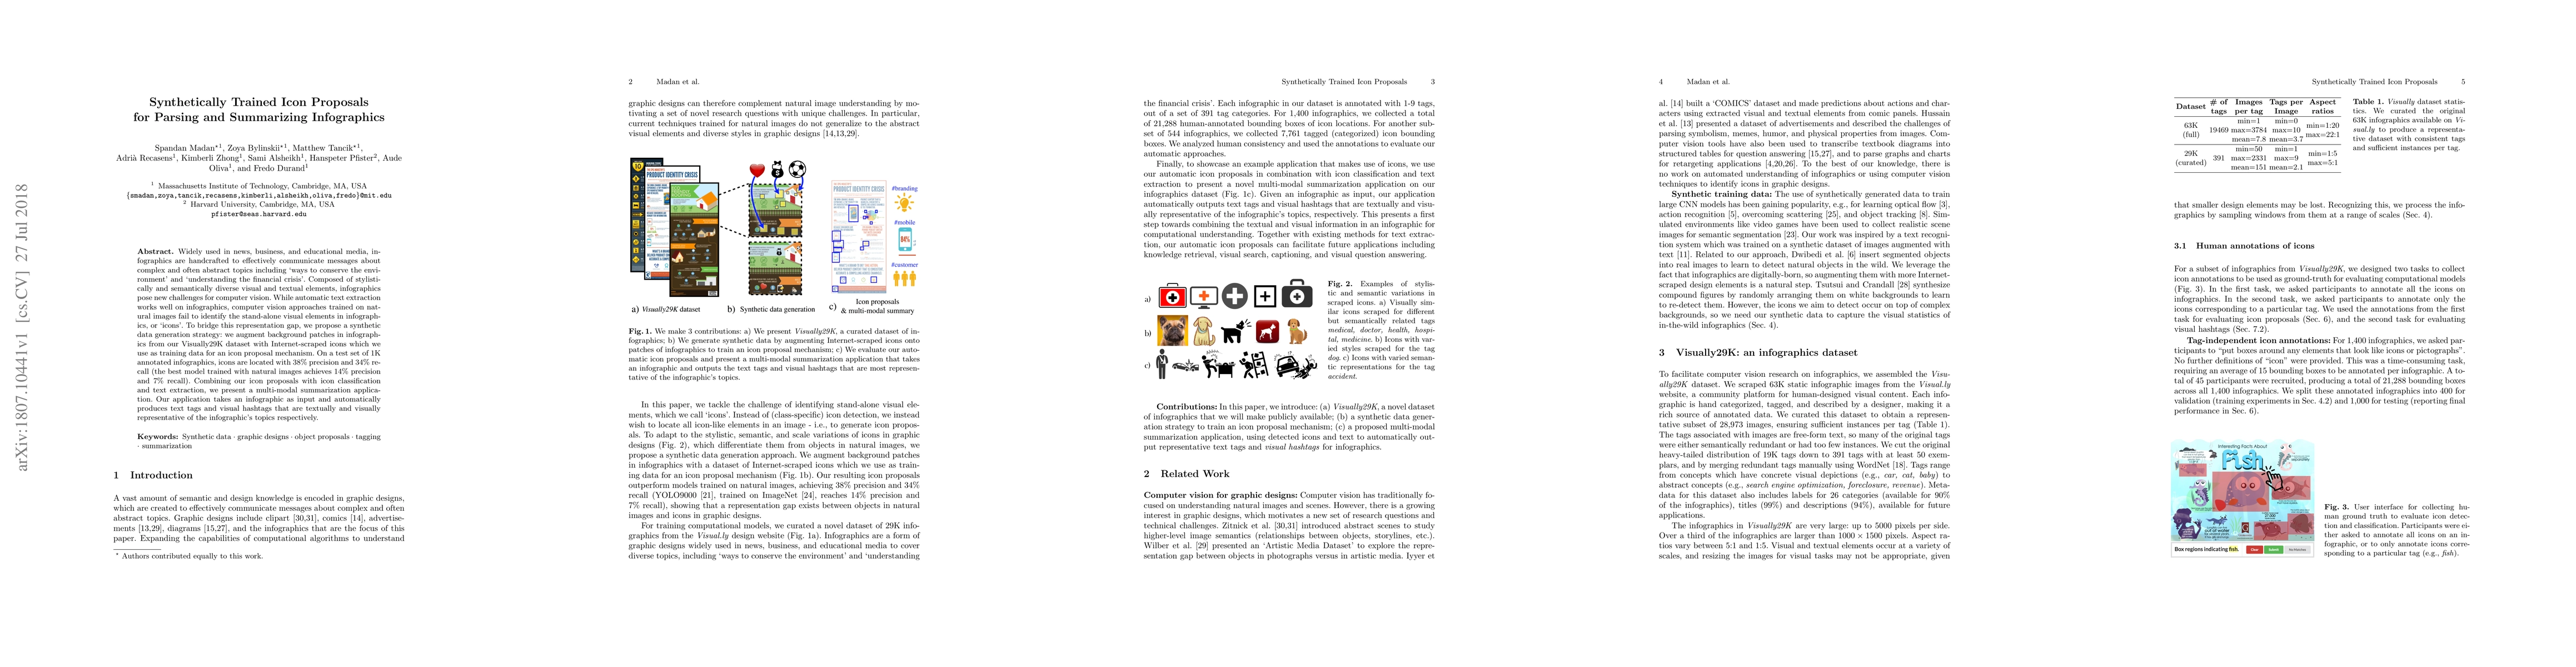
Widely used in news, business, and educational media, infographics are handcrafted to effectively communicate messages about complex and often abstract topics including `ways to conserve the environment' and `understanding the financial crisis'. Composed of stylistically and semantically diverse visual and textual elements, infographics pose new challenges for computer vision. While automatic text extraction works well on infographics, computer vision approaches trained on natural images fail to identify the stand-alone visual elements in infographics, or `icons'. To bridge this representation gap, we propose a synthetic data generation strategy: we augment background patches in infographics from our Visually29K dataset with Internet-scraped icons which we use as training data for an icon proposal mechanism. On a test set of 1K annotated infographics, icons are located with 38% precision and 34% recall (the best model trained with natural images achieves 14% precision and 7% recall). Combining our icon proposals with icon classification and text extraction, we present a multi-modal summarization application. Our application takes an infographic as input and automatically produces text tags and visual hashtags that are textually and visually representative of the infographic's topics respectively.
This graph shows how this paper is connected to other research. The current paper is shown in dark gray, papers that cite it are in green, and papers it references are in blue. You can:
• Hover over any node to see the paper title
• Click a node to view that paper's details
• Drag nodes to rearrange the graph
• Use the zoom controls (bottom right) to zoom in/out
Title | Authors | Year | Actions |
---|---|---|---|
Datasets of Visualization for Machine Learning
|
Can Liu, Ruike Jiang, Shaocong Tan, Jiacheng Yu, Chaofan Yang, Hanning Shao, Xiaoru Yuan
|
2024
|
View Paper |
Synthetic Data for Object Detection with Neural Networks: State-of-the-Art Survey of Domain Randomisation Techniques
|
Adam Westerski, Wee Teck Fong
|
2023
|
View Paper |
The State of the Art in Creating Visualization Corpora for Automated Chart Analysis
|
Chen Chen, Zhicheng Liu
|
2023
|
View Paper |
Jobicon:A Job Icon Dataset for Concept Recognition by Understanding Compositionality
|
Sooyeon Park, Hyunseo Park, Hyuntak Kim, Yongsang Yoo, Min Song
|
2023
|
View Paper |
Infographics Wizard: Flexible Infographics Authoring and Design Exploration
|
Anjul Tyagi, J. Zhao, Pushkar Patel, Swasti Khurana, Klaus Mueller
|
2022
|
View Paper |
IconQA: A New Benchmark for Abstract Diagram Understanding and Visual Language Reasoning
|
Pan Lu, Liang Qiu, Jiaqi Chen, Tony Xia, Yizhou Zhao, Wei Zhang, Zhou Yu, Xiaodan Liang, Song-Chun Zhu
|
2021
|
View Paper |
Towards Natural Language Interfaces for Data Visualization: A Survey
|
Leixian Shen, Enya Shen, Yuyu Luo, Xiaocong Yang, Xuming Hu, Xiongshuai Zhang, Zhiwei Tai, Jianmin Wang
|
2021
|
View Paper |
User-Centric Semi-Automated Infographics Authoring and Recommendation
|
Anjul Tyagi, Jian Zhao, Pushkar Patel, Swasti Khurana, Klaus Mueller
|
2021
|
View Paper |
InfographicVQA
|
Minesh Mathew, Viraj Bagal, Rubèn Pérez Tito, Dimosthenis Karatzas, Ernest Valveny, C.V. Jawahar
|
2021
|
View Paper |
Learning Multimodal Affinities for Textual Editing in Images
|
Or Perel, Oron Anschel, Omri Ben-Eliezer, Shai Mazor, Hadar Averbuch-Elor
|
2021
|
View Paper |
A Survey on ML4VIS: Applying Machine Learning Advances to Data Visualization
|
Qianwen Wang, Zhutian Chen, Yong Wang, Huamin Qu
|
2020
|
View Paper |
ICONATE: Automatic Compound Icon Generation and Ideation
|
Nanxuan Zhao, N. Kim, L. Herman, H. Pfister, Rynson W. H. Lau, J. Echevarria, Z. Bylinskii
|
2020
|
View Paper |
Towards Automated Infographic Design: Deep Learning-based Auto-Extraction of Extensible Timeline
|
Zhutian Chen, Yun Wang, Qianwen Wang, Yong Wang, Huamin Qu
|
2019
|
View Paper |
Text-to-Viz: Automatic Generation of Infographics from Proportion-Related Natural Language Statements
|
Weiwei Cui, Xiaoyu Zhang, Yun Wang, He Huang, B. Chen, Lei Fang, Haidong Zhang, Jian-Guang Lou, Dongmei Zhang
|
2019
|
View Paper |
Jian Zhao, Klaus Mueller, Anjul Tyagi, Pushkar Patel, Swasti Khurana
Published: 2022-08-23
Yixin Yang, Fangwei Zhu, Zhifang Sui, Linli Yao, Qingxiu Dong
Published: 2025-05-08
Abhanshu Sharma, Jindong Chen, Hassan Mansoor, Victor Cărbune, Gilles Baechler, Fedir Zubach, Jason Lin, Maria Wang, Srinivas Sunkara, Vincent Etter
Published: 2024-02-20
Comments (0)