Authors
Summary
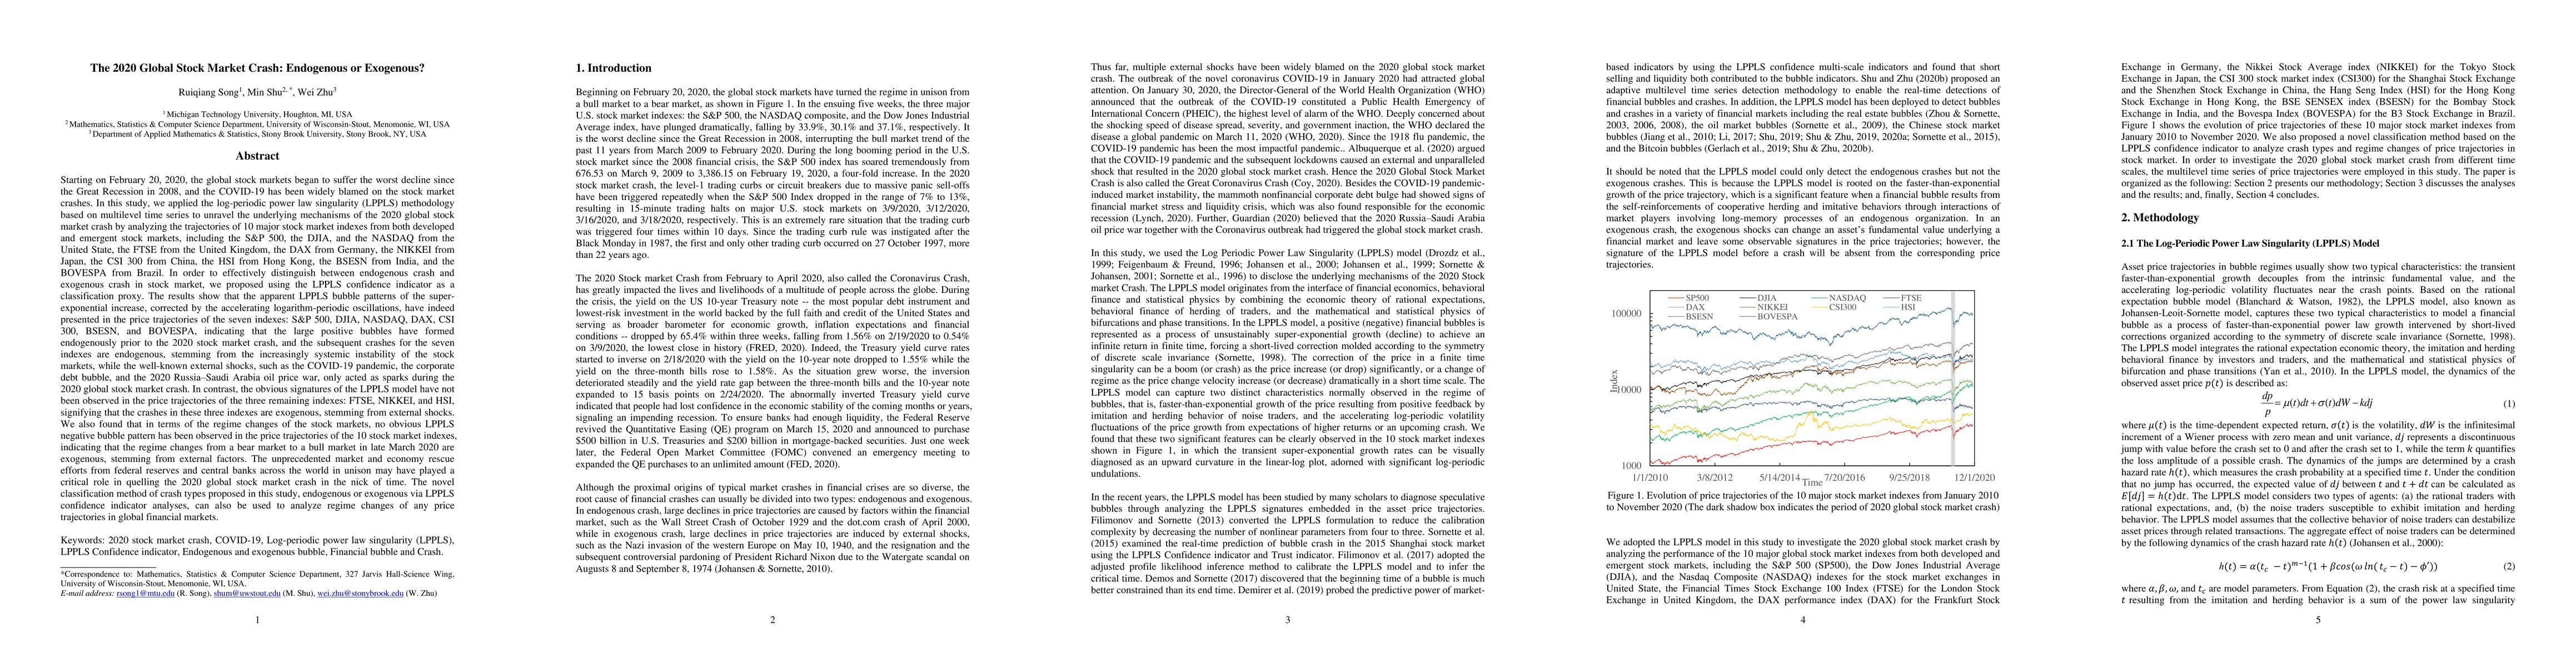
Starting on February 20, 2020, the global stock markets began to suffer the worst decline since the Great Recession in 2008, and the COVID-19 has been widely blamed on the stock market crashes. In this study, we applied the log-periodic power law singularity (LPPLS) methodology based on multilevel time series to unravel the underlying mechanisms of the 2020 global stock market crash by analyzing the trajectories of 10 major stock market indexes from both developed and emergent stock markets, including the S&P 500, DJIA, NASDAQ, FTSE, DAX, NIKKEI, CSI 300, HSI, BSESN, and BOVESPA. In order to effectively distinguish between endogenous crash and exogenous crash, we proposed using the LPPLS confidence indicator as a classification proxy. The results show that the apparent LPPLS bubble patterns of the super-exponential increase, corrected by the accelerating logarithm-periodic oscillations, have indeed presented in the price trajectories of the seven indexes: S&P 500, DJIA, NASDAQ, DAX, CSI 300, BSESN, and BOVESPA, indicating that the large positive bubbles have formed endogenously prior to the 2020 stock market crash, and the subsequent crashes for the seven indexes are endogenous, stemming from the increasingly systemic instability of the stock markets, while the well-known external shocks such as the COVID-19 pandemic etc. only acted as sparks during the 2020 global stock market crash. In contrast, the obvious signatures of the LPPLS model have not been observed in the price trajectories of the three remaining indexes: FTSE, NIKKEI, and HSI, signifying that the crashes in these three indexes are exogenous, stemming from external shocks. The novel classification method of crash types proposed in this study can also be used to analyze regime changes of any price trajectories in global financial markets.
AI Key Findings
Get AI-generated insights about this paper's methodology, results, and significance.
Paper Details
PDF Preview
Key Terms
Citation Network
Current paper (gray), citations (green), references (blue)
Display is limited for performance on very large graphs.
| Title | Authors | Year | Actions |
|---|
Comments (0)