Summary
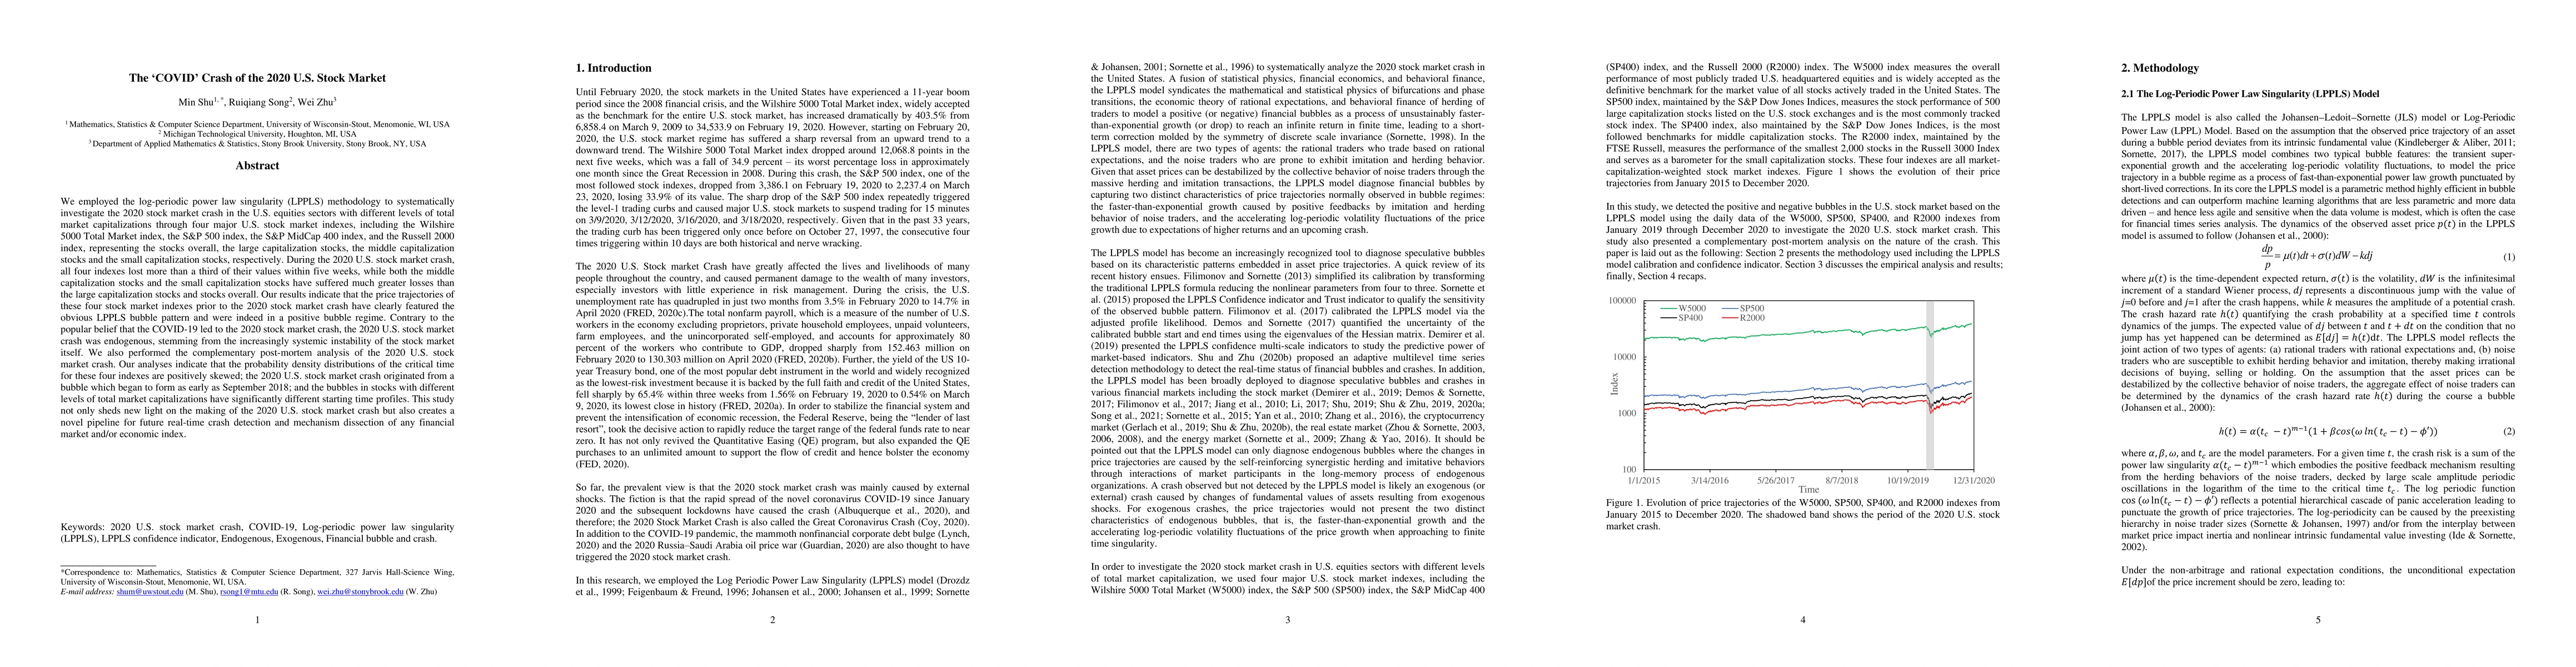
We employed the log-periodic power law singularity (LPPLS) methodology to systematically investigate the 2020 stock market crash in the U.S. equities sectors with different levels of total market capitalizations through four major U.S. stock market indexes, including the Wilshire 5000 Total Market index, the S&P 500 index, the S&P MidCap 400 index, and the Russell 2000 index, representing the stocks overall, the large capitalization stocks, the middle capitalization stocks and the small capitalization stocks, respectively. During the 2020 U.S. stock market crash, all four indexes lost more than a third of their values within five weeks, while both the middle capitalization stocks and the small capitalization stocks have suffered much greater losses than the large capitalization stocks and stocks overall. Our results indicate that the price trajectories of these four stock market indexes prior to the 2020 stock market crash have clearly featured the obvious LPPLS bubble pattern and were indeed in a positive bubble regime. Contrary to the popular belief that the COVID-19 led to the 2020 stock market crash, the 2020 U.S. stock market crash was endogenous, stemming from the increasingly systemic instability of the stock market itself. We also performed the complementary post-mortem analysis of the 2020 U.S. stock market crash. Our analyses indicate that the 2020 U.S. stock market crash originated from a bubble which began to form as early as September 2018; and the bubbles in stocks with different levels of total market capitalizations have significantly different starting time profiles. This study not only sheds new light on the making of the 2020 U.S. stock market crash but also creates a novel pipeline for future real-time crash detection and mechanism dissection of any financial market and/or economic index.
AI Key Findings
Get AI-generated insights about this paper's methodology, results, and significance.
Paper Details
PDF Preview
Key Terms
Citation Network
Current paper (gray), citations (green), references (blue)
Display is limited for performance on very large graphs.
Similar Papers
Found 4 papers| Title | Authors | Year | Actions |
|---|
Comments (0)