The Impact of Sampling Variability on Estimated Combinations of Distributional Forecasts
Publication
Metrics
AI Quick Summary
Researchers investigate how sampling variability affects forecast combinations, finding that combining forecasts in a single step can lead to better accuracy and lower variability than traditional two-step methods.
Paper Preview
Abstract
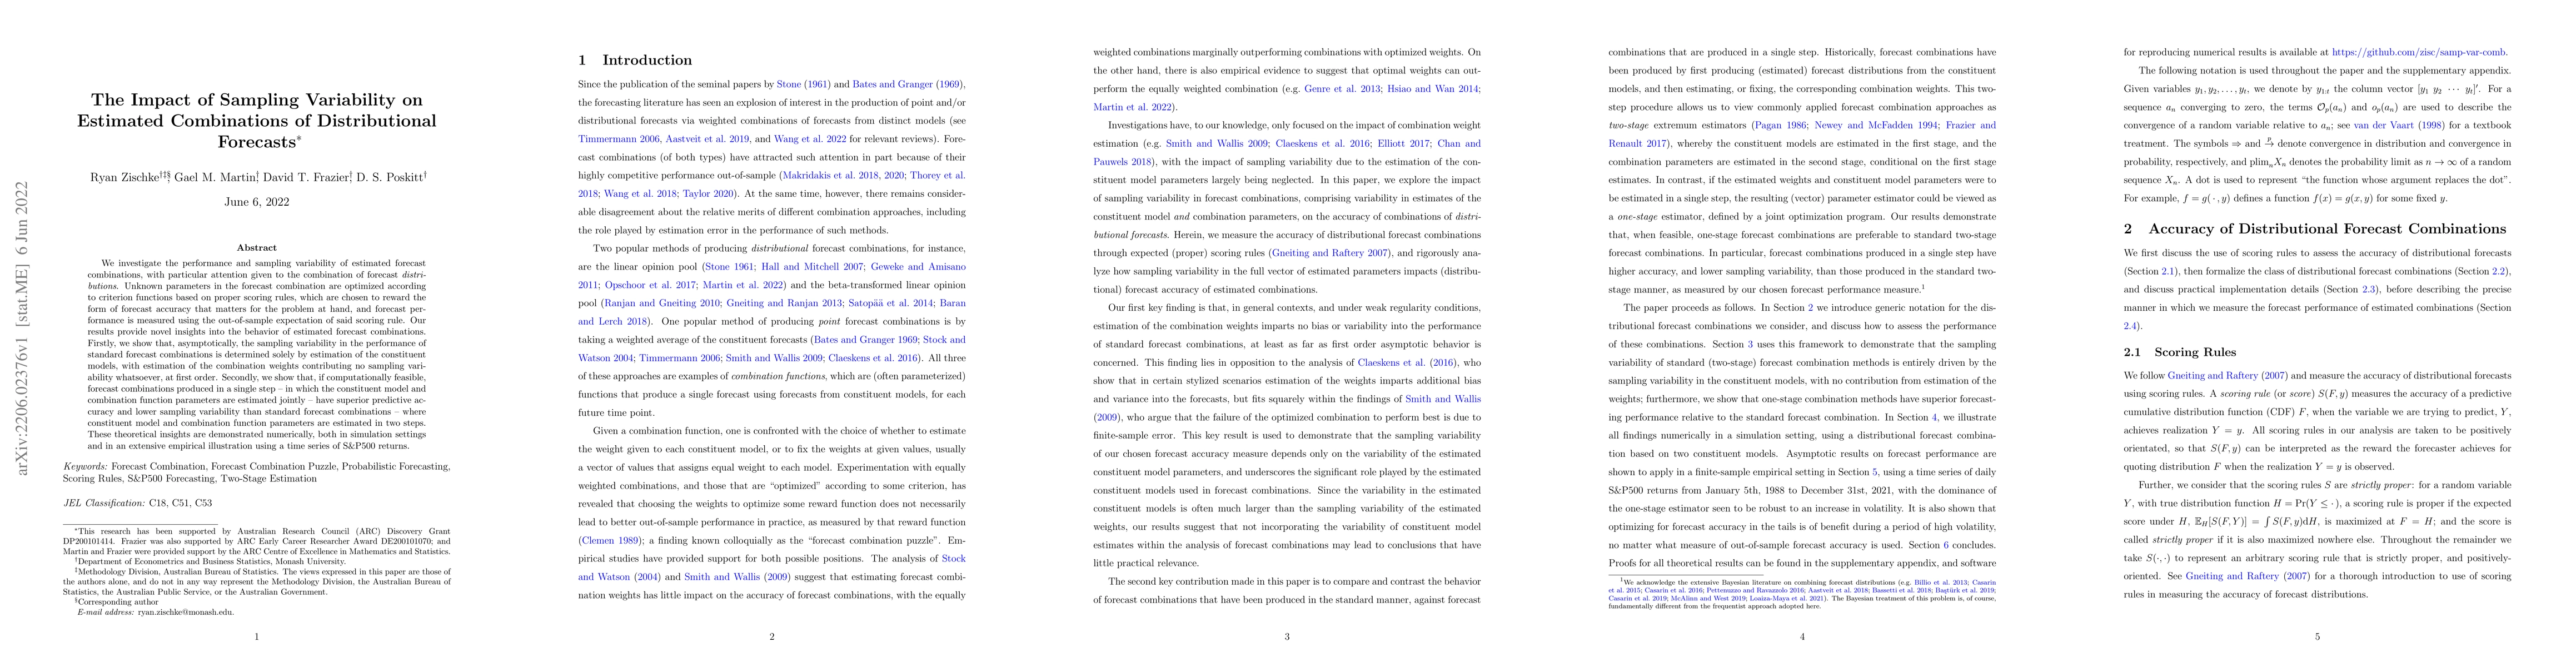
We investigate the performance and sampling variability of estimated forecast combinations, with particular attention given to the combination of forecast distributions. Unknown parameters in the forecast combination are optimized according to criterion functions based on proper scoring rules, which are chosen to reward the form of forecast accuracy that matters for the problem at hand, and forecast performance is measured using the out-of-sample expectation of said scoring rule. Our results provide novel insights into the behavior of estimated forecast combinations. Firstly, we show that, asymptotically, the sampling variability in the performance of standard forecast combinations is determined solely by estimation of the constituent models, with estimation of the combination weights contributing no sampling variability whatsoever, at first order. Secondly, we show that, if computationally feasible, forecast combinations produced in a single step -- in which the constituent model and combination function parameters are estimated jointly -- have superior predictive accuracy and lower sampling variability than standard forecast combinations -- where constituent model and combination function parameters are estimated in two steps. These theoretical insights are demonstrated numerically, both in simulation settings and in an extensive empirical illustration using a time series of S&P500 returns.
AI Key Findings
Get AI-generated insights about this paper's methodology, results, significance, and more — seven facets brought into focus.
Impact
Paper Details
Authors
PDF Preview
Key Terms
Citation Network
Current paper (gray), citations (green), references (blue)
Display is limited for performance on very large graphs.
Discussion 0