Publication
Metrics
AI Quick Summary
This paper investigates the counterintuitive relationship between volatility and stability in financial markets, finding that both high and low volatility can indicate instability. The study uses mean first hitting time as a stability indicator and shows that, contrary to conventional wisdom, low volatility can also lead to higher instability.
Paper Preview
Abstract
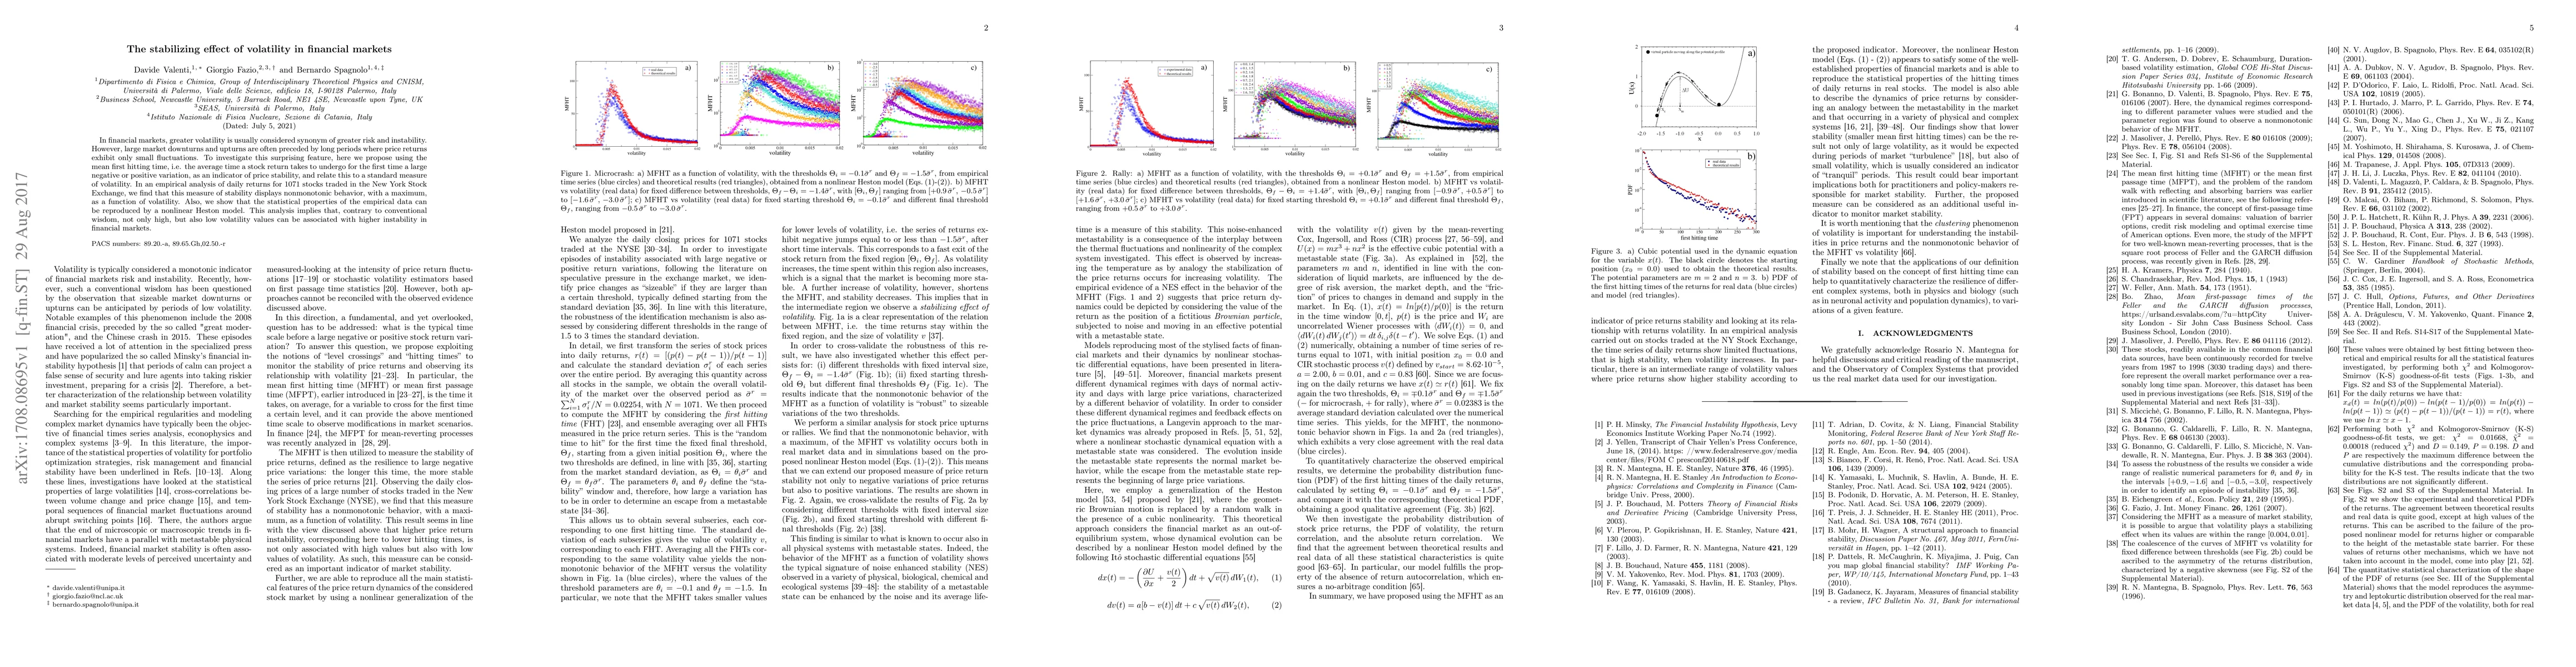
In financial markets, greater volatility is usually considered synonym of greater risk and instability. However, large market downturns and upturns are often preceded by long periods where price returns exhibit only small fluctuations. To investigate this surprising feature, here we propose using the mean first hitting time, i.e. the average time a stock return takes to undergo for the first time a large negative or positive variation, as an indicator of price stability, and relate this to a standard measure of volatility. In an empirical analysis of daily returns for $1071$ stocks traded in the New York Stock Exchange, we find that this measure of stability displays nonmonotonic behavior, with a maximum, as a function of volatility. Also, we show that the statistical properties of the empirical data can be reproduced by a nonlinear Heston model. This analysis implies that, contrary to conventional wisdom, not only high, but also low volatility values can be associated with higher instability in financial markets.
AI Key Findings
Get AI-generated insights about this paper's methodology, results, significance, and more — seven facets brought into focus.
Impact
Paper Details
PDF Preview
Key Terms
Citation Network
Current paper (gray), citations (green), references (blue)
Display is limited for performance on very large graphs.
Discussion 0