Time Series Analysis of Urban Liveability
Publication
Metrics
AI Quick Summary
This paper uses deep learning models to track changes in urban liveability across Dutch cities using the Leefbaarometer score and high-resolution aerial images. Results indicate complex trends, highlighting the need for advanced methods to account for non-liveability related changes.
Paper Preview
Abstract
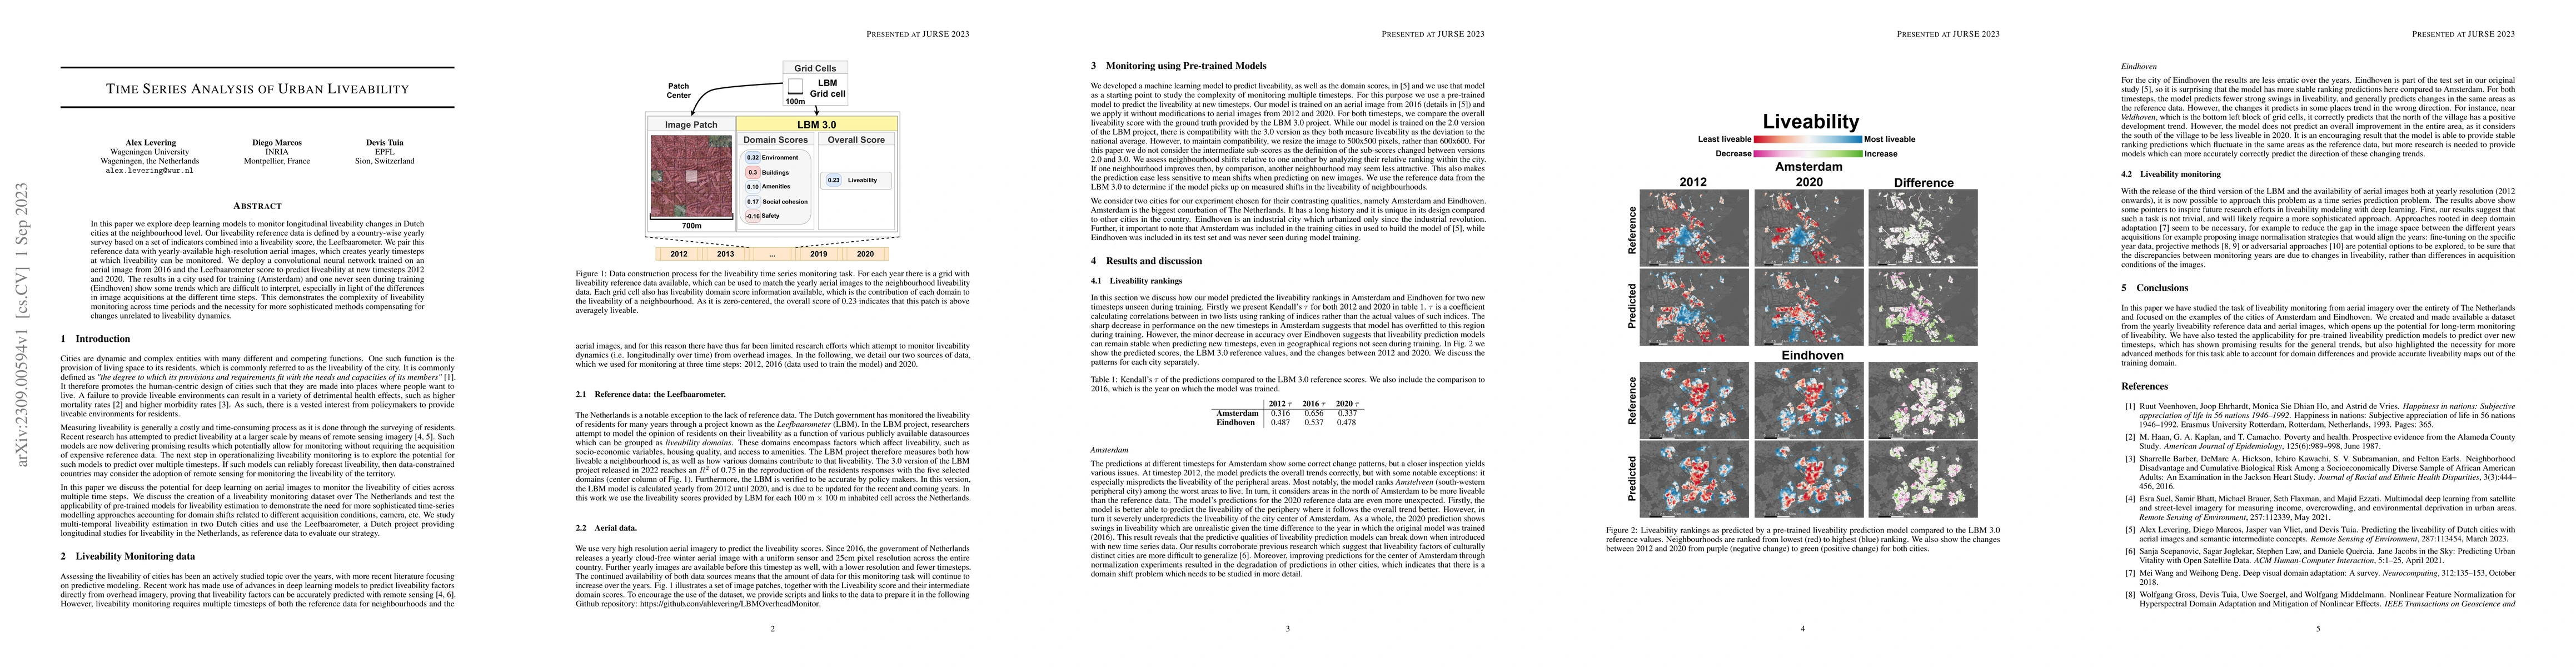
In this paper we explore deep learning models to monitor longitudinal liveability changes in Dutch cities at the neighbourhood level. Our liveability reference data is defined by a country-wise yearly survey based on a set of indicators combined into a liveability score, the Leefbaarometer. We pair this reference data with yearly-available high-resolution aerial images, which creates yearly timesteps at which liveability can be monitored. We deploy a convolutional neural network trained on an aerial image from 2016 and the Leefbaarometer score to predict liveability at new timesteps 2012 and 2020. The results in a city used for training (Amsterdam) and one never seen during training (Eindhoven) show some trends which are difficult to interpret, especially in light of the differences in image acquisitions at the different time steps. This demonstrates the complexity of liveability monitoring across time periods and the necessity for more sophisticated methods compensating for changes unrelated to liveability dynamics.
AI Key Findings
Get AI-generated insights about this paper's methodology, results, significance, and more — seven facets brought into focus.
Impact
Paper Details
Authors
PDF Preview
Key Terms
Citation Network
Current paper (gray), citations (green), references (blue)
Display is limited for performance on very large graphs.
Discussion 0