AI Quick Summary
This paper employs volatility constrained correlation (VC correlation) to determine the directional influence between financial statement variables for 2321 firms listed on the Tokyo Stock Exchange from 1990 to 2018. It finds that operating income is the most influential, while market capitalization and revenue are the most susceptible, challenging conventional investment strategies.
Paper Preview
Abstract
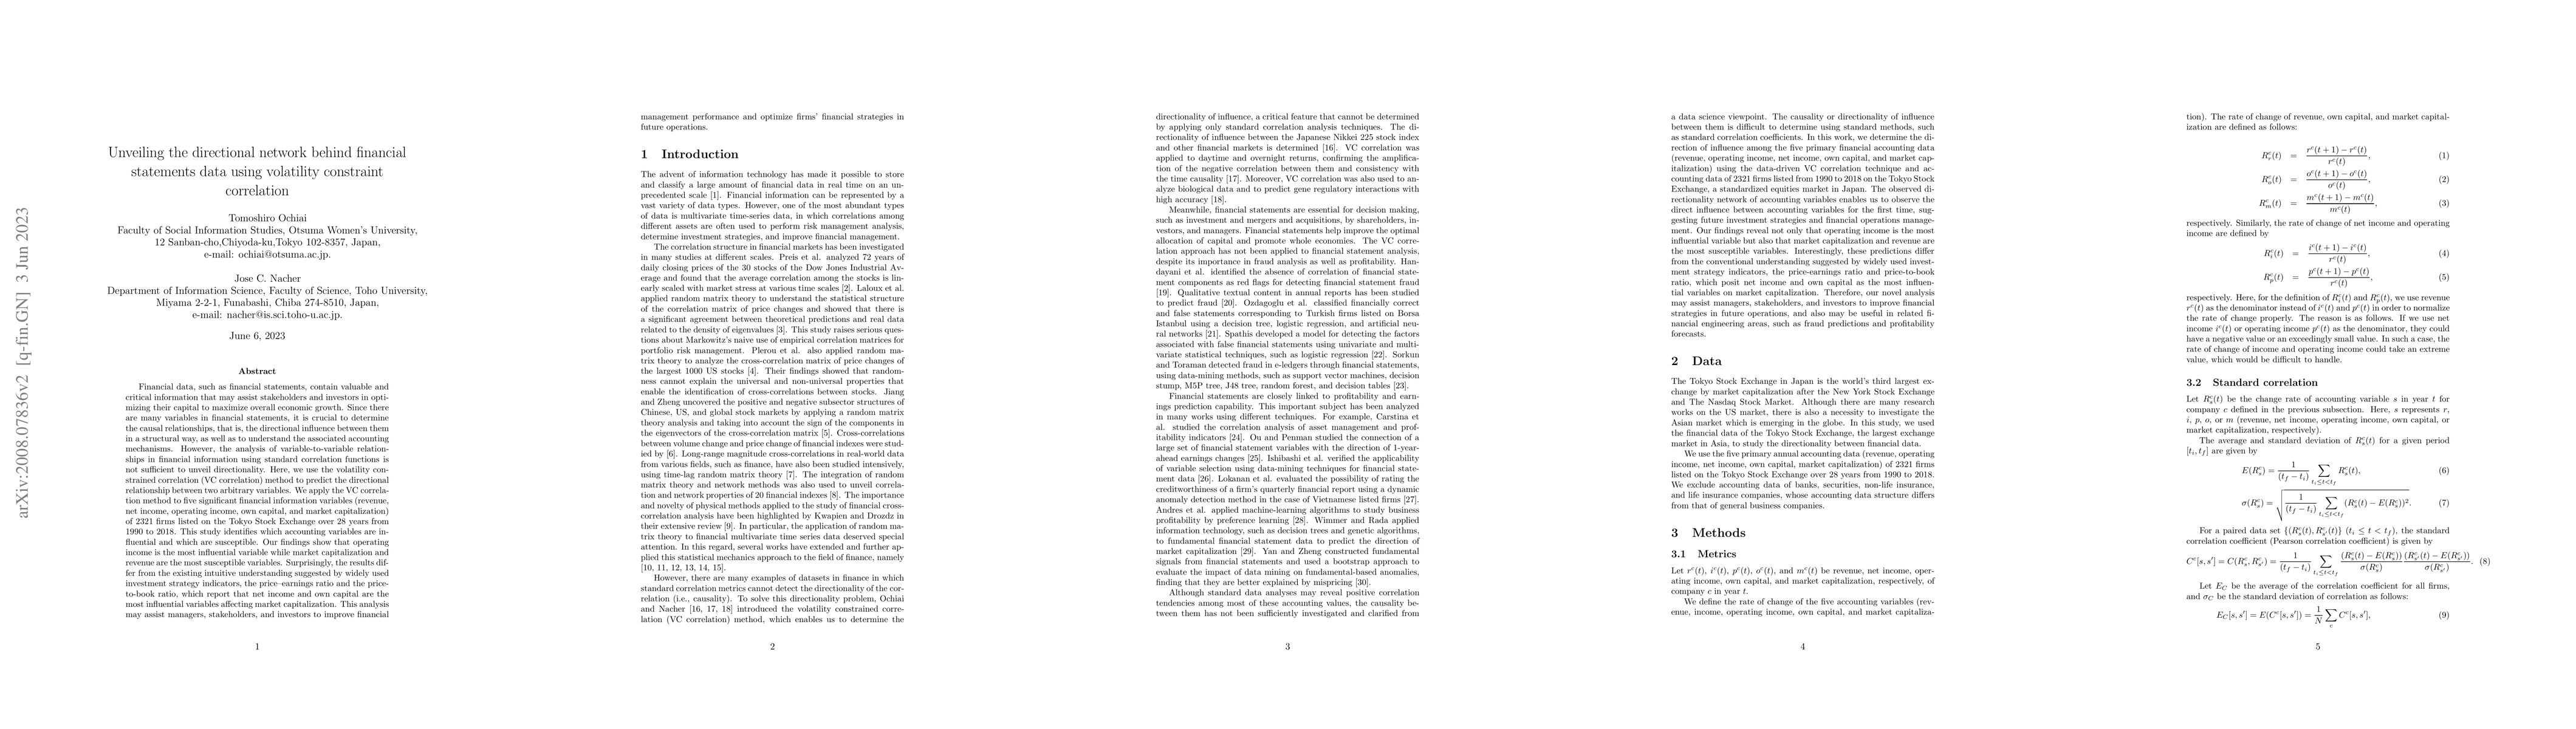
Financial data, such as financial statements, contain valuable and critical information that may assist stakeholders and investors in optimizing their capital to maximize overall economic growth. Since there are many variables in financial statements, it is crucial to determine the causal relationships, that is, the directional influence between them in a structural way, as well as to understand the associated accounting mechanisms. However, the analysis of variable-to-variable relationships in financial information using standard correlation functions is not sufficient to unveil directionality. Here, we use the volatility constrained correlation (VC correlation) method to predict the directional relationship between two arbitrary variables. We apply the VC correlation method to five significant financial information variables (revenue, net income, operating income, own capital, and market capitalization) of 2321 firms listed on the Tokyo Stock Exchange over 28 years from 1990 to 2018. This study identifies which accounting variables are influential and which are susceptible. Our findings show that operating income is the most influential variable while market capitalization and revenue are the most susceptible variables. Surprisingly, the results differ from the existing intuitive understanding suggested by widely used investment strategy indicators, the price--earnings ratio and the price-to-book ratio, which report that net income and own capital are the most influential variables affecting market capitalization. This analysis may assist managers, stakeholders, and investors to improve financial management performance and optimize firms' financial strategies in future operations.
AI Key Findings
Get AI-generated insights about this paper's methodology, results, and significance.
Paper Details
How to Cite This Paper
@article{nacher2023unveiling,
  title         = {Unveiling the directional network behind the financial statements data
  using volatility constraint correlation},
  author        = {Nacher, Jose C. and Ochiai, Tomoshiro},
  year          = {2023},
  eprint        = {2008.07836},
  archivePrefix = {arXiv},
  primaryClass  = {q-fin.GN},
  doi           = {10.1016/j.physa.2022.127534},
}Nacher, J., & Ochiai, T. (2023). Unveiling the directional network behind the financial statements data
using volatility constraint correlation. arXiv. https://doi.org/10.1016/j.physa.2022.127534Nacher, Jose C., and Tomoshiro Ochiai. "Unveiling the directional network behind the financial statements data
using volatility constraint correlation." arXiv, 2023, doi.org/10.1016/j.physa.2022.127534.PDF Preview
Key Terms
Citation Network
Current paper (gray), citations (green), references (blue)
Display is limited for performance on very large graphs.
Similar Papers
Found 4 papersState Heterogeneity Analysis of Financial Volatility Using High-Frequency Financial Data
Dohyun Chun, Donggyu Kim
Russian Financial Statements Database: A firm-level collection of the universe of financial statements
Sergey Bondarkov, Victor Ledenev, Dmitriy Skougarevskiy
| Title | Authors | Year | Actions |
|---|
Comments (0)