Visual Analytics and Human Involvement in Machine Learning
Publication
Metrics
AI Quick Summary
It identifies seven key steps in the ML process and recommends relevant visualizations for each step, emphasizing the need for domain-specific approaches to maximize data insights.
Paper Preview
Abstract
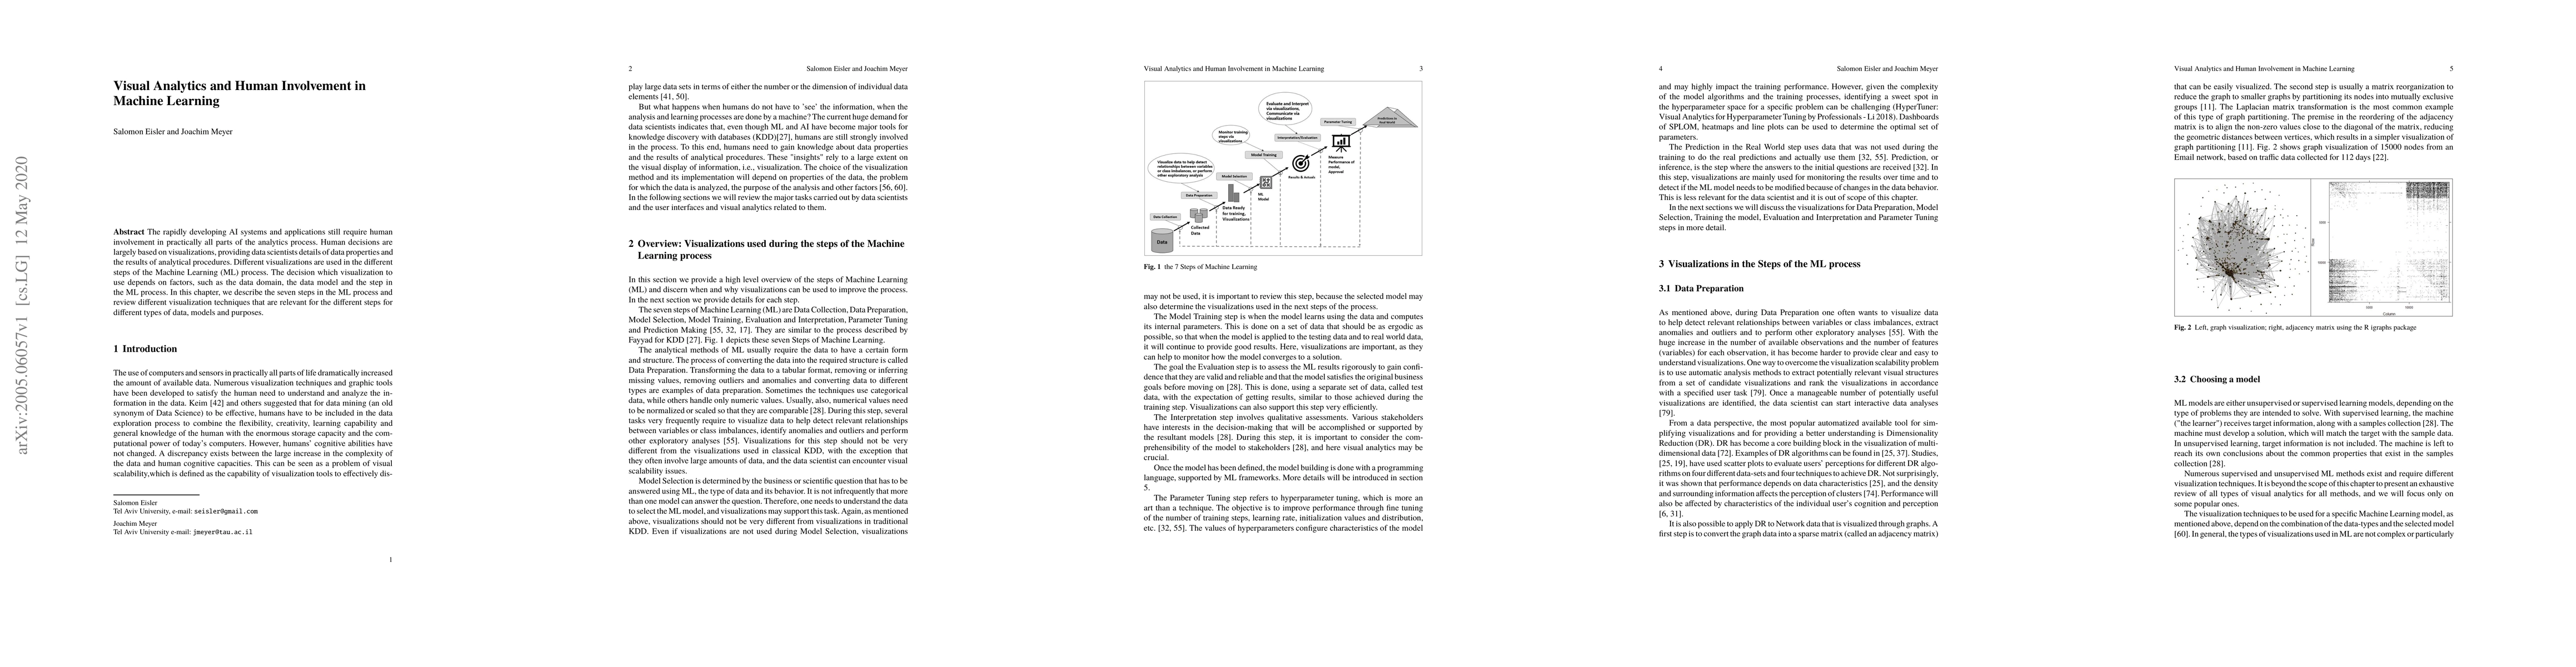
The rapidly developing AI systems and applications still require human involvement in practically all parts of the analytics process. Human decisions are largely based on visualizations, providing data scientists details of data properties and the results of analytical procedures. Different visualizations are used in the different steps of the Machine Learning (ML) process. The decision which visualization to use depends on factors, such as the data domain, the data model and the step in the ML process. In this chapter, we describe the seven steps in the ML process and review different visualization techniques that are relevant for the different steps for different types of data, models and purposes.
AI Key Findings
Get AI-generated insights about this paper's methodology, results, significance, and more — seven facets brought into focus.
Impact
Paper Details
Authors
PDF Preview
Key Terms
Citation Network
Current paper (gray), citations (green), references (blue)
Display is limited for performance on very large graphs.
Discussion 0