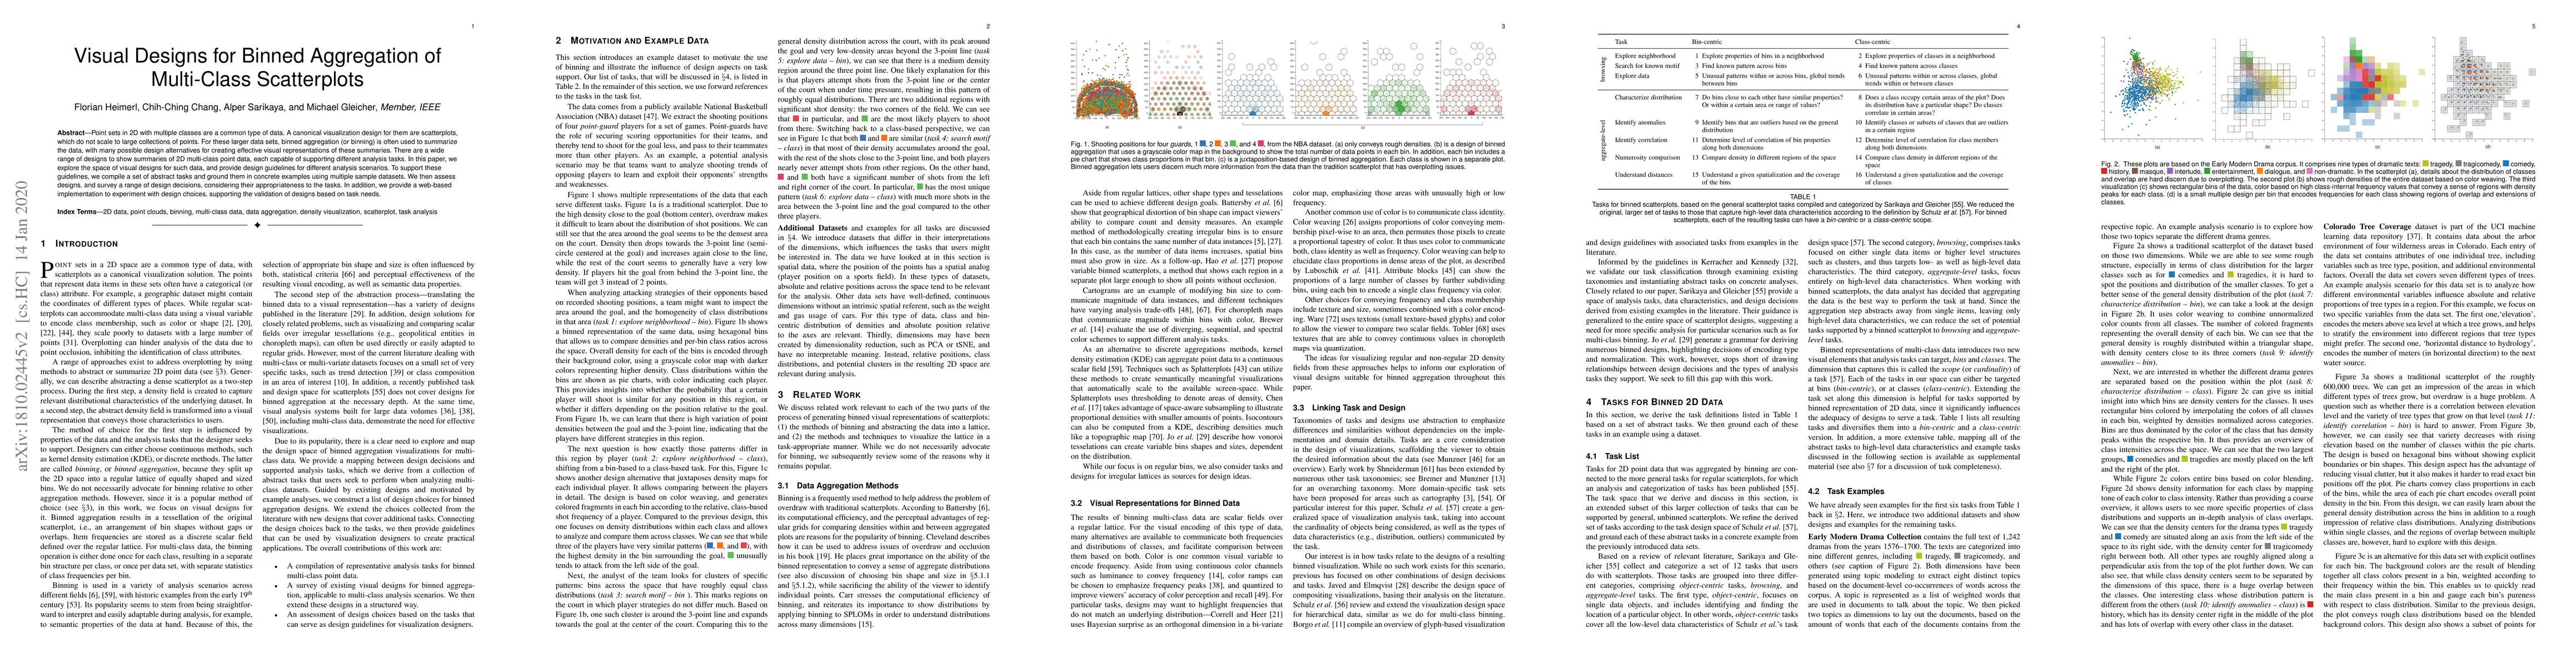
Point sets in 2D with multiple classes are a common type of data. A canonical visualization design for them are scatterplots, which do not scale to large collections of points. For these larger data sets, binned aggregation (or binning) is often used to summarize the data, with many possible design alternatives for creating effective visual representations of these summaries. There are a wide range of designs to show summaries of 2D multi-class point data, each capable of supporting different analysis tasks. In this paper, we explore the space of visual designs for such data, and provide design guidelines for different analysis scenarios. To support these guidelines, we compile a set of abstract tasks and ground them in concrete examples using multiple sample datasets. We then assess designs, and survey a range of design decisions, considering their appropriateness to the tasks. In addition, we provide a web-based implementation to experiment with design choices, supporting the validation of designs based on task needs.
Get AI-generated insights about this paper's methodology, results, and significance.
Current paper (gray), citations (green), references (blue)
Michael Gleicher, Daniel Braun, Remco Chang et al.
Khairi Reda, Oliver Deussen, Yunhai Wang et al.
Title | Authors | Year | Actions |
---|---|---|---|
A Scalable Approach to Clustering Embedding Projections
|
Donghao Ren, Fred Hohman, Dominik Moritz
|
2025
|
View Paper |
MANDALA—Visual Exploration of Anomalies in Industrial Multivariate Time Series Data
|
Josef Suschnigg, B. Mutlu, G. Koutroulis, H. Hussain, T. Schreck
|
2025
|
View Paper |
Enhancing Text Corpus Exploration with Post Hoc Explanations and Comparative Design
|
Michael Gleicher, Keaton Leppenan, Yunyu Bai
|
2024
|
View Paper |
Empty Area Matters: Bivariate K-Nearest Neighbor Based Scatterplot Overlap Removal Algorithm
|
Ruizhi Shi, Jiawan Zhang
|
2024
|
View Paper |
Hardware-accelerated Rendering of Web-based 3D Scatter Plots with Projected Density Fields and Embedded Controls
|
Lukas Wagner, Daniel Limberger, Willy Scheibel, J. Döllner
|
2022
|
View Paper |
Dual Space Coupling Model Guided Overlap-Free Scatterplot
|
Zeyu Li, Ruizhi Shi, Y. Liu, Shizhuo Long, Ziheng Guo, Shichao Jia, Jiawan Zhang
|
2022
|
View Paper |
Trinary Tools for Continuously Valued Binary Classifiers
|
Michael Gleicher, Xinyi Yu, Yuheng Chen
|
2022
|
View Paper |
Nirmaan: Dataset generation for multiclass scatterplot studies
|
Wong Allison, Joshi Alark, Engle Sophie
|
2022
|
View Paper |
Construct boundaries and place labels for multi-class scatterplots
|
Zeyu Li, Teng Wang, M. Wang, Jiawan Zhang
|
2021
|
View Paper |
NetScatter: Visual analytics of multivariate time series with a hybrid of dynamic and static variable relationships
|
B. D. Nguyen, R. Hewett, Tommy Dang
|
2021
|
View Paper |
Comparative Layouts Revisited: Design Space, Guidelines, and Future Directions
|
S. L’Yi, Jaemin Jo, Jinwook Seo
|
2020
|
View Paper |
Kyrix-S: Authoring Scalable Scatterplot Visualizations of Big Data
|
Wenbo Tao, Xinli Hou, Adam Sah, L. Battle, Remco Chang, M. Stonebraker
|
2020
|
View Paper |
SMAP: A Joint Dimensionality Reduction Scheme for Secure Multi-Party Visualization
|
Jiazhi Xia, Tianxiang Chen, Lei Zhang, Wei Chen, Yang Chen, X. Zhang, C. Xie, Tobias Schreck
|
2020
|
View Paper |
Micro diagrams: visualization of categorical point data from location-based social media
|
M. Gröbe, D. Burghardt
|
2020
|
View Paper |
embComp: Visual Interactive Comparison of Vector Embeddings
|
Florian Heimerl, Christoph Kralj, Torsten Möller, Michael Gleicher
|
2019
|
View Paper |
Master thesis User-centric geospatial analytics and visualization of catastrophe risk portfolio using the example of the insurance industry
|
Lin Zhu
|
2022
|
View Paper |
Honeycomb Plots: Visual Enhancements for Hexagonal Maps
|
T. Trautner, M. Sbardellati, Sergej Stoppel, S. Bruckner
|
2022
|
View Paper |
Master thesis User-centric geospatial analytics and visualization of catastrophe risk portfolio using the example of the insurance industry
|
Lin Zhu
|
2020
|
View Paper |
Comments (0)