W-shaped implied volatility curves in a variance-gamma mixture model
Publication
Metrics
AI Quick Summary
This paper demonstrates that W-shaped implied volatility curves can be modeled using a mixture of two variance-gamma models, offering a simpler alternative compared to lognormal models that require mixing at least three distributions to achieve the same shape.
Paper Preview
Abstract
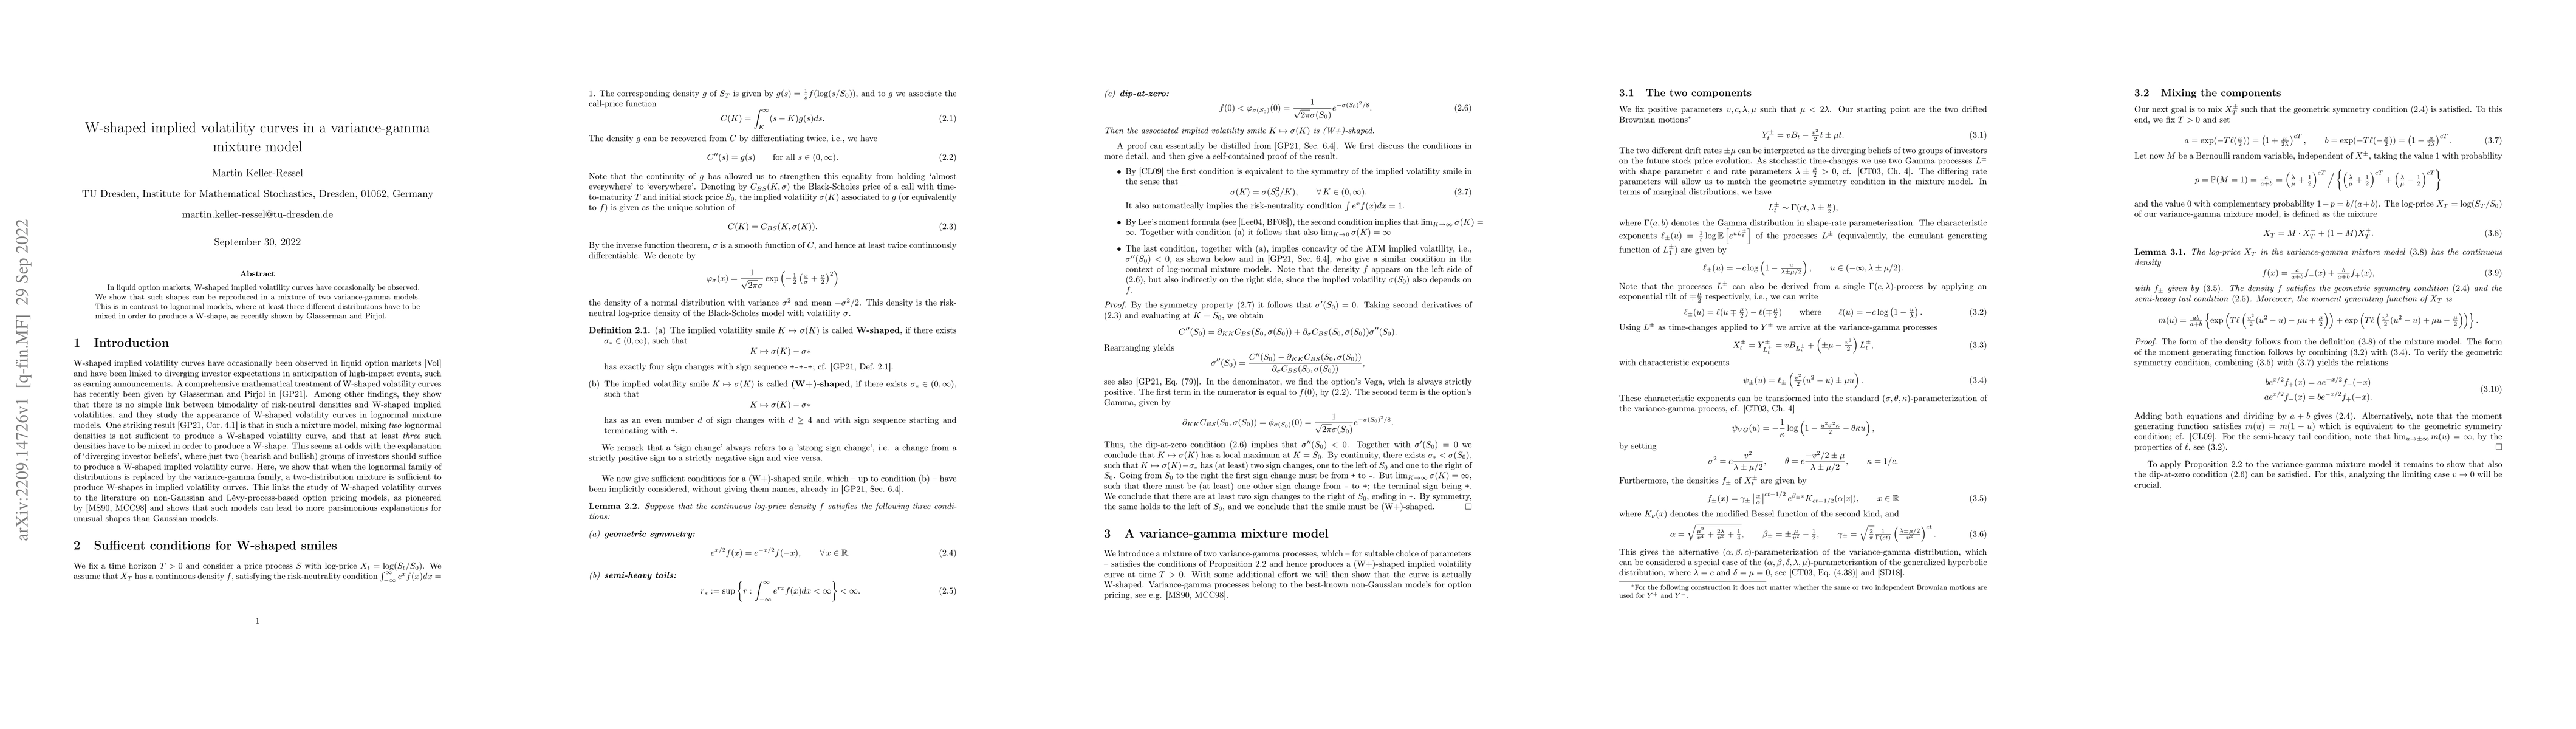
In liquid option markets, W-shaped implied volatility curves have occasionally be observed. We show that such shapes can be reproduced in a mixture of two variance-gamma models. This is in contrast to lognormal models, where at least three different distributions have to be mixed in order to produce a W-shape, as recently shown by Glasserman and Pirjol.
AI Key Findings
Get AI-generated insights about this paper's methodology, results, significance, and more — seven facets brought into focus.
Impact
Paper Details
Authors
PDF Preview
Key Terms
Citation Network
Current paper (gray), citations (green), references (blue)
Display is limited for performance on very large graphs.
Discussion 0