ArxivLens

Quick Summary:

This paper investigates how to semantically label visual features in line charts by combining feature-word distributions with data domain context. The study uses crowdsourced data to develop a feature-word-topic model that identifies nuanced semantic relationships, demonstrating its application in chart annotation and textual summary generation.

arXiv Id: 2308.01370
Comments: 5 pages and 3 figures
Date Published: 2023-08-04
Date Updated: 2023-08-04

Categories:

Key Terms (TF-IDF):

visual (0.299)
word (0.275)
semantics (0.215)
topic (0.204)
feature (0.203)
features (0.197)
concepts (0.186)
sharp (0.183)
increase (0.151)
dataset (0.144)
associations (0.138)
textual (0.135)
labeling (0.134)
plateau (0.134)
collect (0.132)
novel method (0.131)
vs (0.130)
quantified (0.126)
signatures (0.118)
labeled (0.118)
License: http://creativecommons.org/licenses/by/4.0/

Summary:

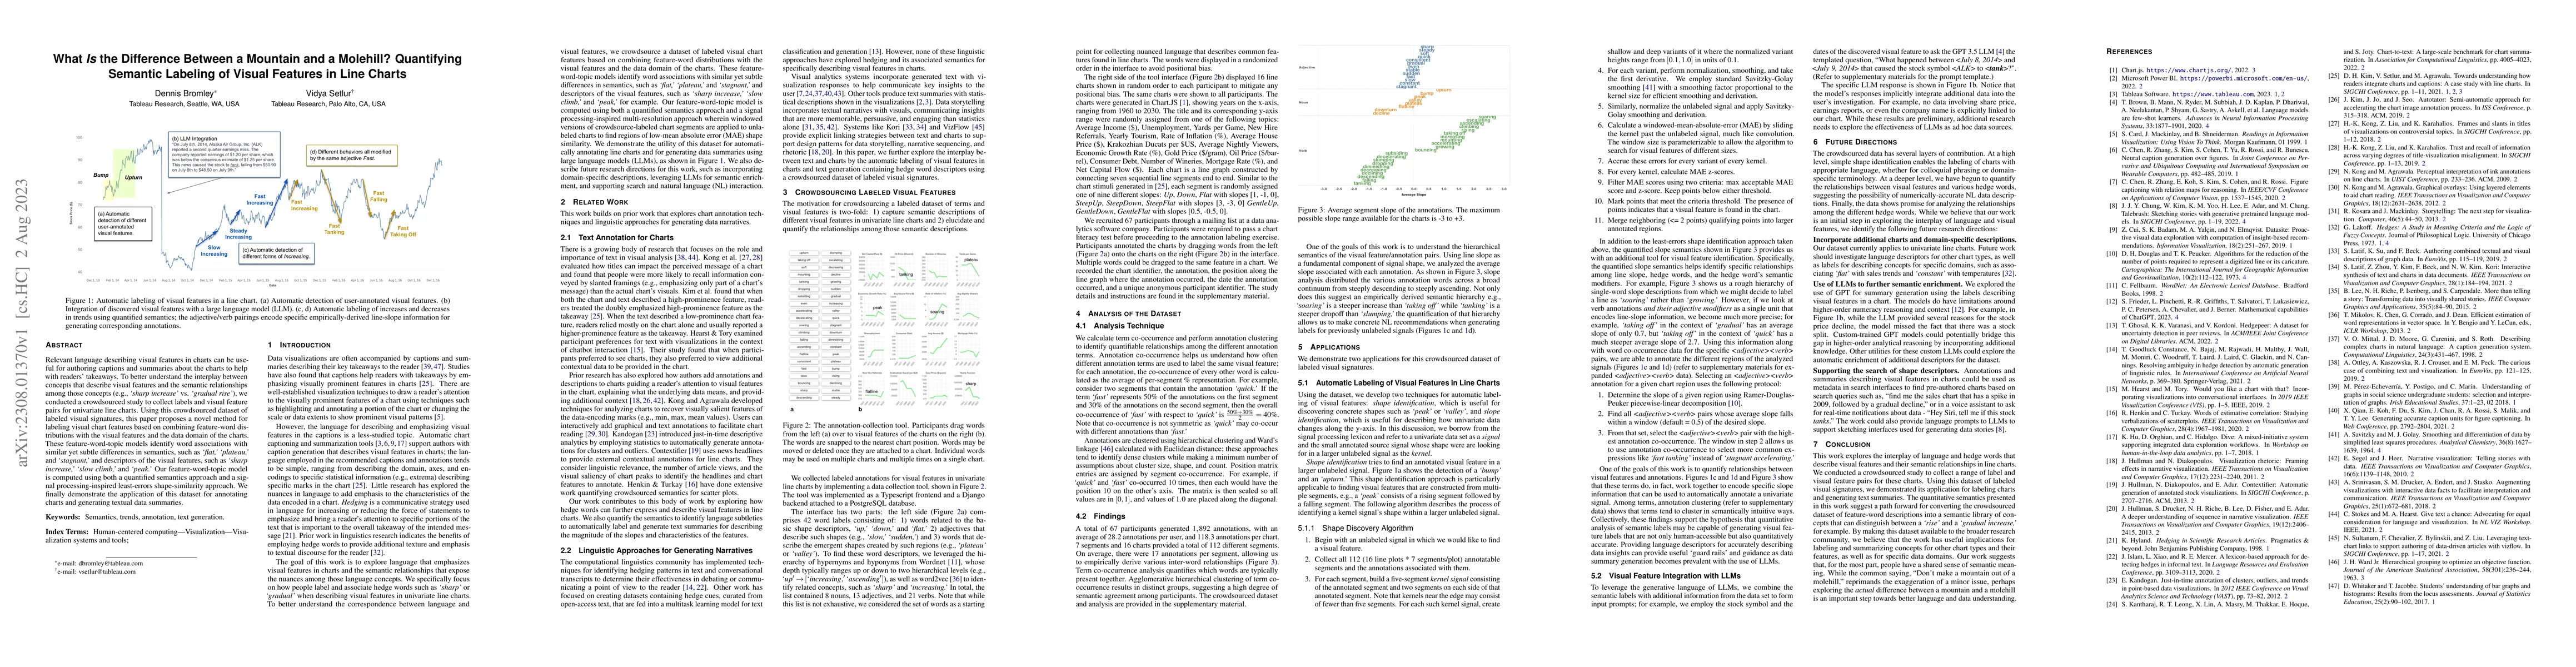
Relevant language describing visual features in charts can be useful for authoring captions and summaries about the charts to help with readers' takeaways. To better understand the interplay between concepts that describe visual features and the semantic relationships among those concepts (e.g., 'sharp increase' vs. 'gradual rise'), we conducted a crowdsourced study to collect labels and visual feature pairs for univariate line charts. Using this crowdsourced dataset of labeled visual signatures, this paper proposes a novel method for labeling visual chart features based on combining feature-word distributions with the visual features and the data domain of the charts. These feature-word-topic models identify word associations with similar yet subtle differences in semantics, such as 'flat,' 'plateau,' and 'stagnant,' and descriptors of the visual features, such as 'sharp increase,' 'slow climb,' and 'peak.' Our feature-word-topic model is computed using both a quantified semantics approach and a signal processing-inspired least-errors shape-similarity approach. We finally demonstrate the application of this dataset for annotating charts and generating textual data summaries.

Citation & Reference Network Visualization

This graph shows how this paper is connected to other research. The current paper is shown in dark gray, papers that cite it are in green, and papers it references are in blue. You can:

Current Paper
Papers citing this work (Citations)
Papers cited by this work (References)

• Hover over any node to see the paper title

• Click a node to view that paper's details

• Drag nodes to rearrange the graph

• Use the zoom controls (bottom right) to zoom in/out

Citations and References

Title Authors Year Actions
Probing the Visualization Literacy of Vision Language Models: the Good, the Bad, and the Ugly
Lianghan Dong, Anamaria Crisan
2025
View Paper
Jupybara: Operationalizing a Design Space for Actionable Data Analysis and Storytelling with LLMs
Huichen Will Wang, Larry Birnbaum, V. Setlur
2025
View Paper
A Survey on Annotations in Information Visualization: Empirical Insights, Applications, and Challenges
Md Dilshadur Rahman, Bhavana Doppalapudi, Ghulam Jilani Quadri, Paul Rosen
2024
View Paper
"The Data Says Otherwise" — Towards Automated Fact-checking and Communication of Data Claims
Yu Fu, Shunan Guo, J. Hoffswell, Victor S. Bursztyn, R. Rossi, J. Stasko
2024
View Paper
How Aligned are Human Chart Takeaways and LLM Predictions? A Case Study on Bar Charts with Varying Layouts
Huichen Will Wang, J. Hoffswell, Sao Myat Thazin Thane, V. S. Bursztyn, Cindy Xiong Bearfield
2024
View Paper
VisTR: Visualizations as Representations for Time-series Table Reasoning
Jianing Hao, Zhuowen Liang, Chunting Li, Yuyu Luo, Jie Li, Wei Zeng
2024
View Paper
Can Nuanced Language Lead to More Actionable Insights? Exploring the Role of Generative AI in Analytical Narrative Structure
V. Setlur, Larry Birnbaum
2024
View Paper
Mixing Modes: Active and Passive Integration of Speech, Text, and Visualization for Communicating Data Uncertainty
Chase Stokes, Chelsea Sanker, Bridget Cogley, V. Setlur
2024
View Paper
SlopeSeeker: A Search Tool for Exploring a Dataset of Quantifiable Trends
Alexander Bendeck, Dennis Bromley, V. Setlur
2024
View Paper
Leveraging Foundation Models for Crafting Narrative Visualization: A Survey.
Yi He, Ke Xu, Shixiong Cao, Yang Shi, Qing Chen, Nan Cao
2024
View Paper

Comments (0)

This website uses cookies to ensure you get the best experience. Learn more