Why Shouldn't All Charts Be Scatter Plots? Beyond Precision-Driven Visualizations
Publication
Metrics
Paper Preview
Abstract
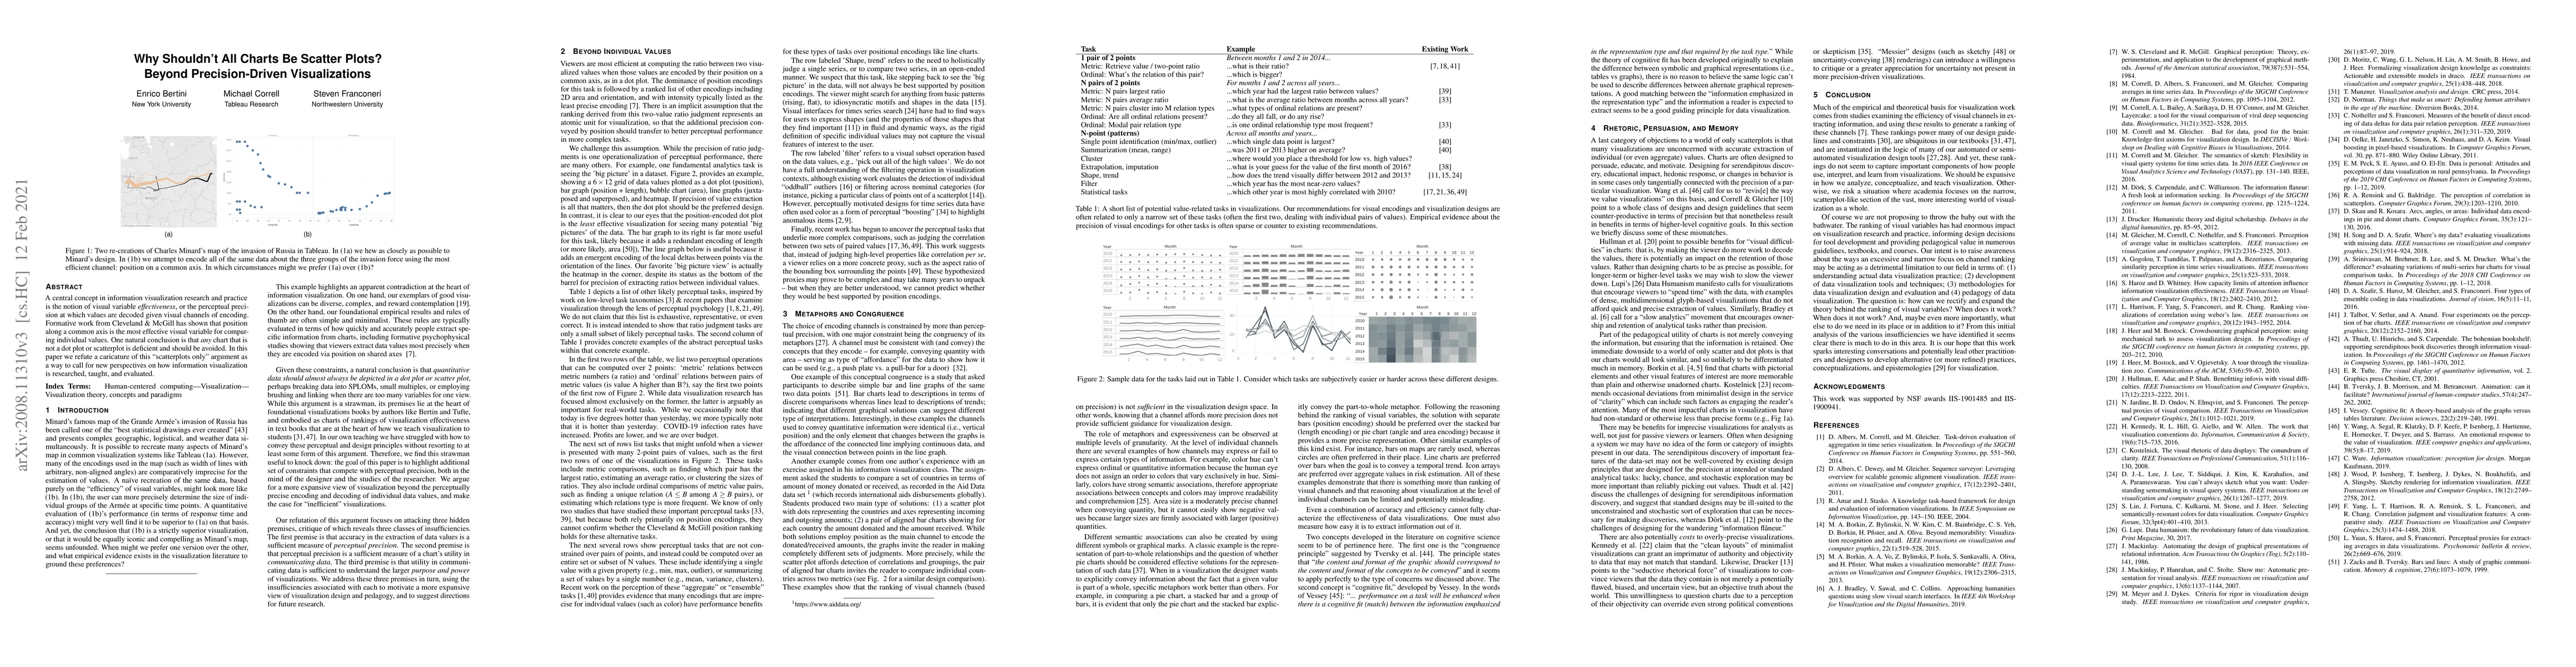
A central concept in information visualization research and practice is the notion of visual variable effectiveness, or the perceptual precision at which values are decoded given visual channels of encoding. Formative work from Cleveland & McGill has shown that position along a common axis is the most effective visual variable for comparing individual values. One natural conclusion is that any chart that is not a dot plot or scatterplot is deficient and should be avoided. In this paper we refute a caricature of this "scatterplots only" argument as a way to call for new perspectives on how information visualization is researched, taught, and evaluated.
AI Key Findings
Get AI-generated insights about this paper's methodology, results, significance, and more — seven facets brought into focus.
Impact
Paper Details
PDF Preview
Key Terms
Citation Network
Current paper (gray), citations (green), references (blue)
Display is limited for performance on very large graphs.
Discussion 0