Publication
Metrics
AI Quick Summary
This paper introduces MulTiDR, a visual analytics framework for processing and interpreting multivariate time-series data through dimensionality reduction. The framework reduces a 3D array of instances, time points, and attributes into a 2D representation, facilitating comprehensive data overview and interpretation.
Paper Preview
Abstract
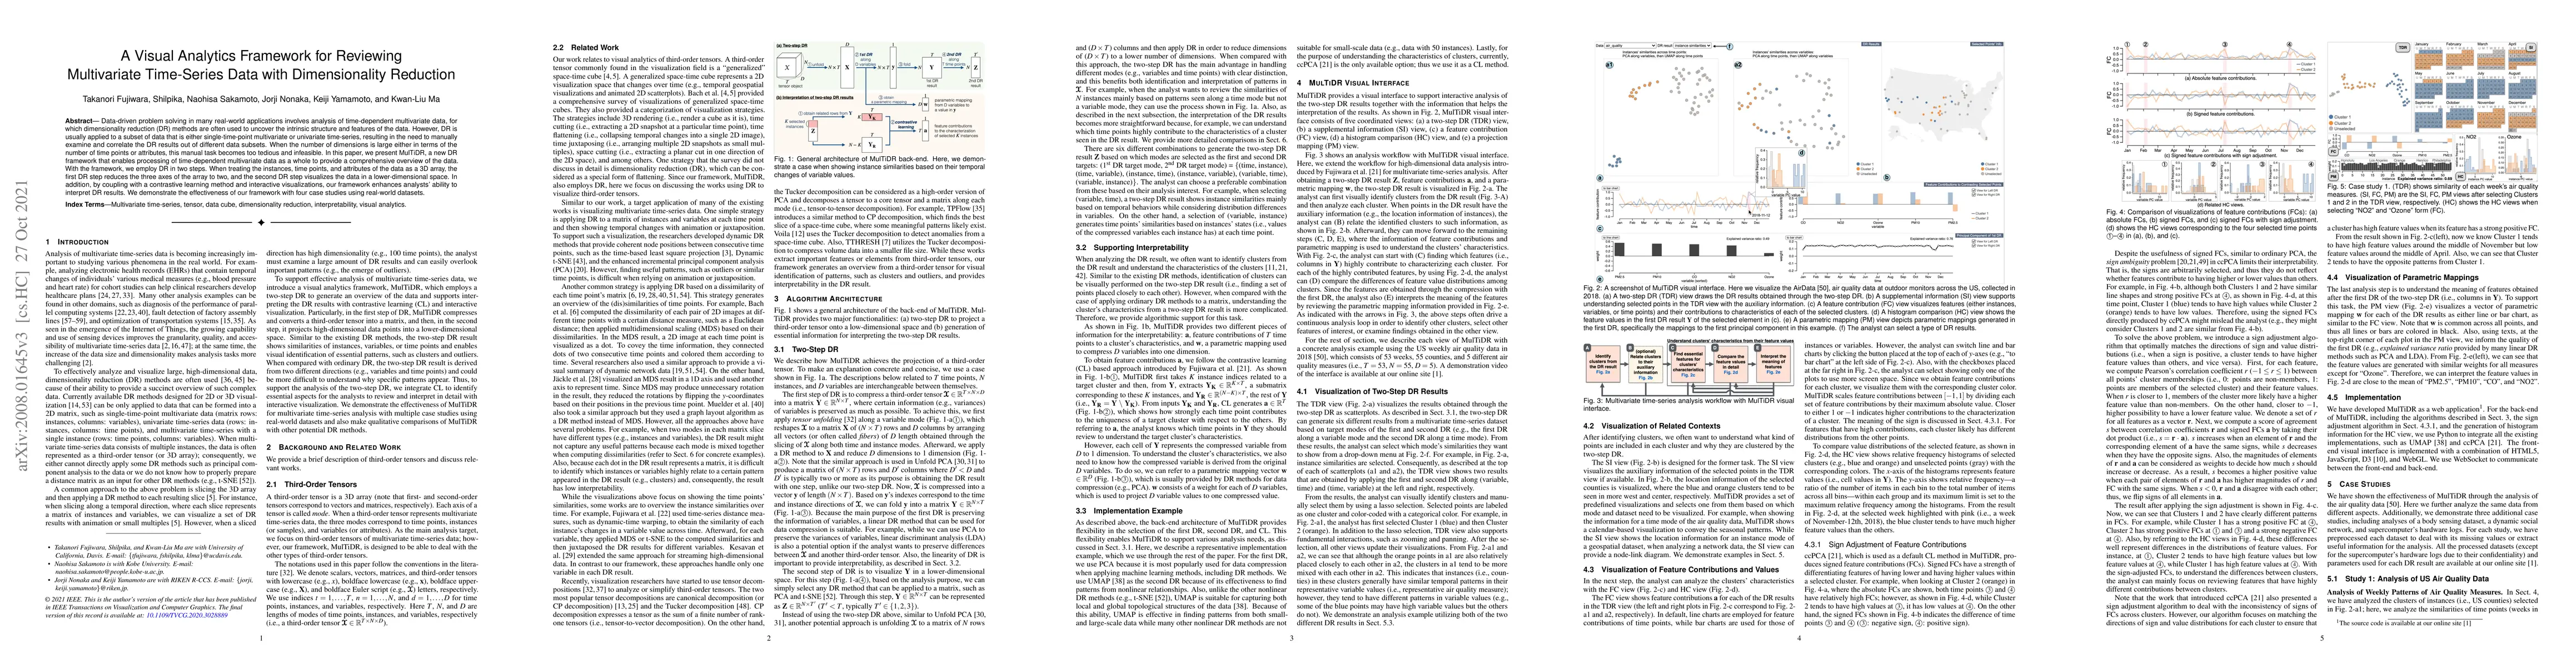
Data-driven problem solving in many real-world applications involves analysis of time-dependent multivariate data, for which dimensionality reduction (DR) methods are often used to uncover the intrinsic structure and features of the data. However, DR is usually applied to a subset of data that is either single-time-point multivariate or univariate time-series, resulting in the need to manually examine and correlate the DR results out of different data subsets. When the number of dimensions is large either in terms of the number of time points or attributes, this manual task becomes too tedious and infeasible. In this paper, we present MulTiDR, a new DR framework that enables processing of time-dependent multivariate data as a whole to provide a comprehensive overview of the data. With the framework, we employ DR in two steps. When treating the instances, time points, and attributes of the data as a 3D array, the first DR step reduces the three axes of the array to two, and the second DR step visualizes the data in a lower-dimensional space. In addition, by coupling with a contrastive learning method and interactive visualizations, our framework enhances analysts' ability to interpret DR results. We demonstrate the effectiveness of our framework with four case studies using real-world datasets.
AI Key Findings
Get AI-generated insights about this paper's methodology, results, significance, and more — seven facets brought into focus.
Impact
Paper Details
Authors
PDF Preview
Key Terms
Citation Network
Current paper (gray), citations (green), references (blue)
Display is limited for performance on very large graphs.
Discussion 0