Publication
Metrics
AI Quick Summary
Chart4Blind proposes an intelligent interface to convert raster graphics of line charts into universally accessible formats, including SVG and CSV, facilitating their use by Blind and Visually Impaired individuals. User studies show that even inexperienced users can achieve high usability in converting charts, demonstrating a comprehensive solution for chart accessibility.
Paper Preview
Abstract
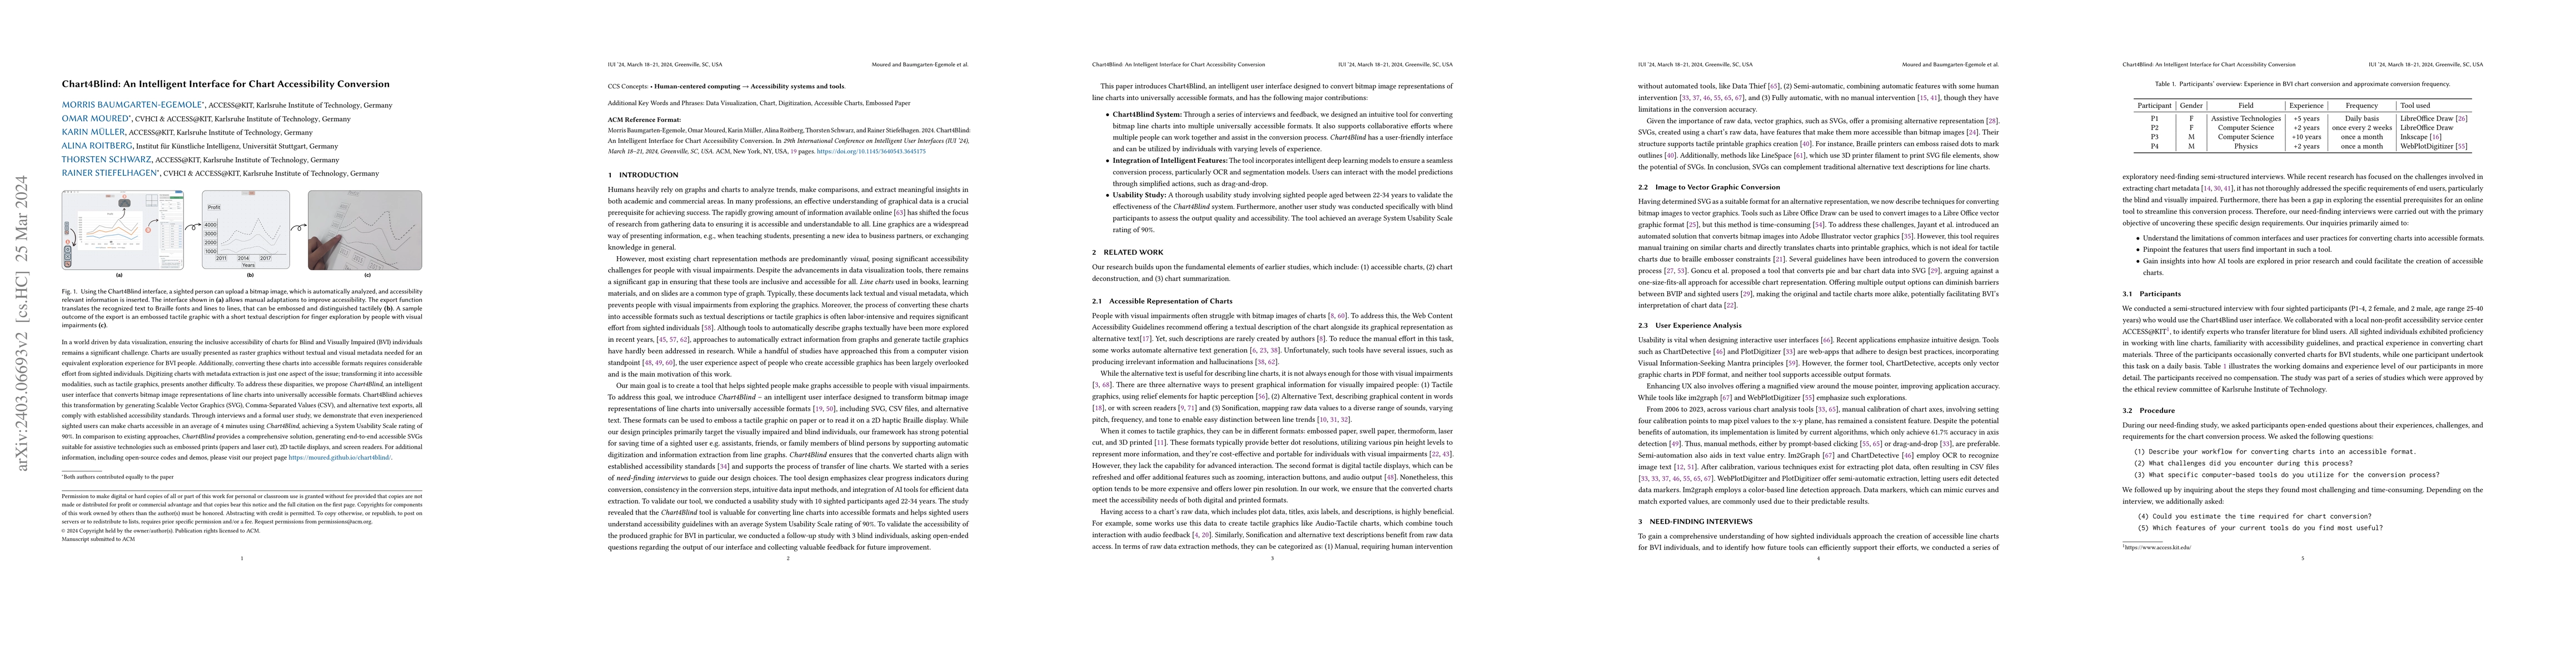
In a world driven by data visualization, ensuring the inclusive accessibility of charts for Blind and Visually Impaired (BVI) individuals remains a significant challenge. Charts are usually presented as raster graphics without textual and visual metadata needed for an equivalent exploration experience for BVI people. Additionally, converting these charts into accessible formats requires considerable effort from sighted individuals. Digitizing charts with metadata extraction is just one aspect of the issue; transforming it into accessible modalities, such as tactile graphics, presents another difficulty. To address these disparities, we propose Chart4Blind, an intelligent user interface that converts bitmap image representations of line charts into universally accessible formats. Chart4Blind achieves this transformation by generating Scalable Vector Graphics (SVG), Comma-Separated Values (CSV), and alternative text exports, all comply with established accessibility standards. Through interviews and a formal user study, we demonstrate that even inexperienced sighted users can make charts accessible in an average of 4 minutes using Chart4Blind, achieving a System Usability Scale rating of 90%. In comparison to existing approaches, Chart4Blind provides a comprehensive solution, generating end-to-end accessible SVGs suitable for assistive technologies such as embossed prints (papers and laser cut), 2D tactile displays, and screen readers. For additional information, including open-source codes and demos, please visit our project page https://moured.github.io/chart4blind/.
AI Key Findings
Get AI-generated insights about this paper's methodology, results, significance, and more — seven facets brought into focus.
Impact
Paper Details
Authors
PDF Preview
Key Terms
Citation Network
Current paper (gray), citations (green), references (blue)
Display is limited for performance on very large graphs.
Discussion 0