Gemini: A Grammar and Recommender System for AnimatedTransitions in Statistical Graphics
Publication
Metrics
AI Quick Summary
Gemini is a declarative grammar and recommendation system designed to simplify the creation of animated transitions in statistical graphics by recommending staged animation designs based on high-level visual components and composition rules. Evaluations show that Gemini's suggestions closely match expert-created animations and avoid common errors.
Paper Preview
Abstract
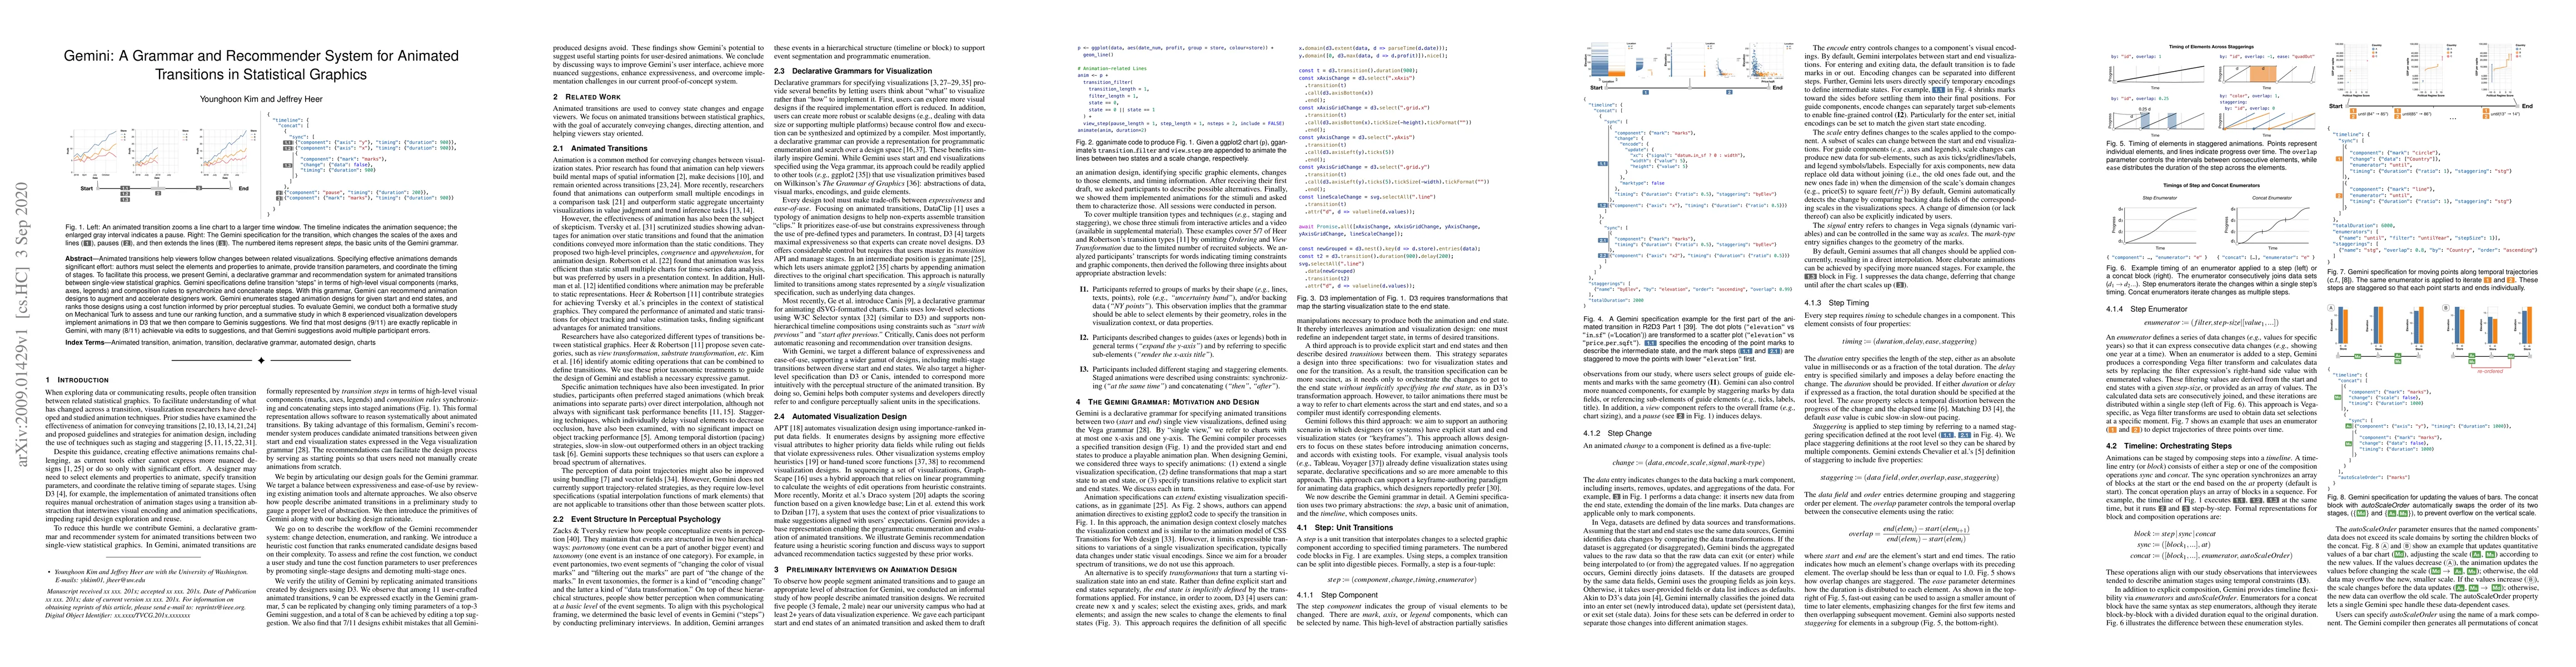
Animated transitions help viewers follow changes between related visualizations. Specifying effective animations demands significant effort: authors must select the elements and properties to animate, provide transition parameters, and coordinate the timing of stages. To facilitate this process, we present Gemini, a declarative grammar and recommendation system for animated transitions between single-view statistical graphics. Gemini specifications define transition "steps" in terms of high-level visual components (marks, axes, legends) and composition rules to synchronize and concatenate steps. With this grammar, Gemini can recommend animation designs to augment and accelerate designers' work. Gemini enumerates staged animation designs for given start and end states, and ranks those designs using a cost function informed by prior perceptual studies. To evaluate Gemini, we conduct both a formative study on Mechanical Turk to assess and tune our ranking function, and a summative study in which 8 experienced visualization developers implement animations in D3 that we then compare to Gemini's suggestions. We find that most designs (9/11) are exactly replicable in Gemini, with many (8/11) achievable via edits to suggestions, and that Gemini suggestions avoid multiple participant errors.
AI Key Findings
Get AI-generated insights about this paper's methodology, results, significance, and more — seven facets brought into focus.
Impact
Paper Details
Authors
PDF Preview
Key Terms
Citation Network
Current paper (gray), citations (green), references (blue)
Display is limited for performance on very large graphs.
Discussion 0