GeneVis - An interactive visualization tool for combining cross-discipline datasets within genetics
Publication
Metrics
Paper Preview
Abstract
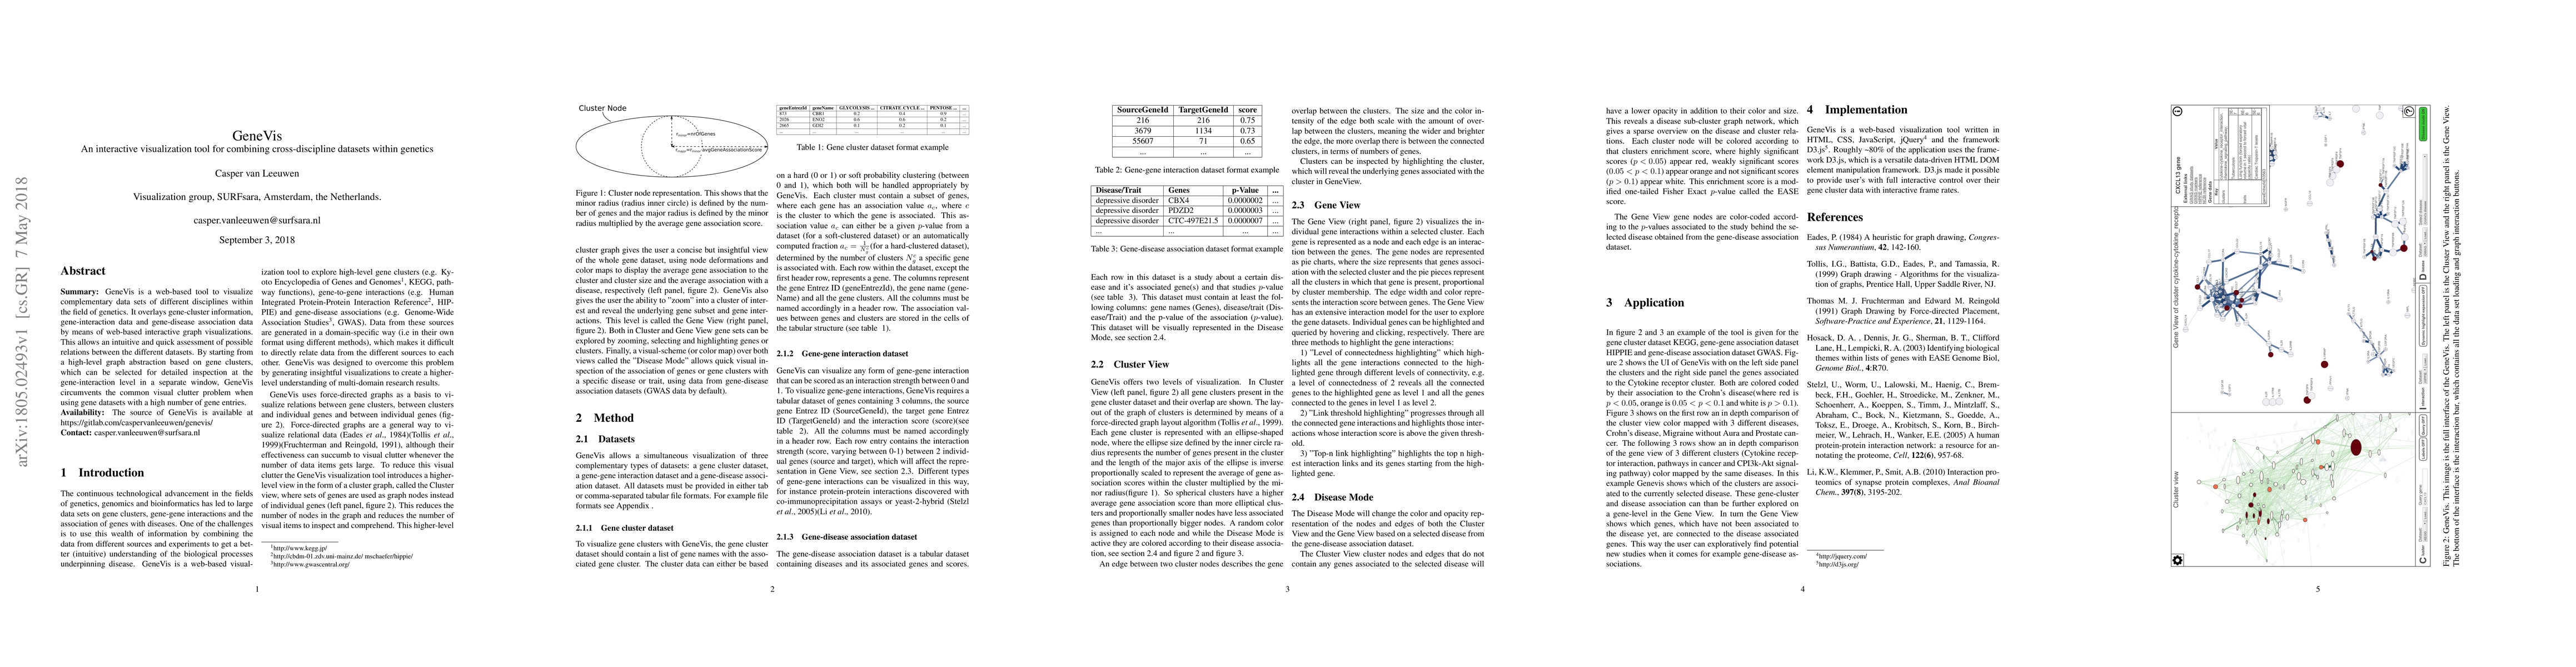
GeneVis is a web-based tool to visualize complementary data sets of different disciplines within the field of genetics. It overlays gene-cluster information, gene-interaction data and gene-disease association data by means of web-based interactive graph visualizations. This allows an intuitive and quick assessment of possible relations between the different datasets. By starting from a high-level graph abstraction based on gene clusters, which can be selected for detailed inspection at the gene-interaction level in a separate window, GeneVis circumvents the common visual clutter problem when using gene datasets with a high number of gene entries.
AI Key Findings
Get AI-generated insights about this paper's methodology, results, significance, and more — seven facets brought into focus.
Impact
Paper Details
PDF Preview
Key Terms
Citation Network
Current paper (gray), citations (green), references (blue)
Display is limited for performance on very large graphs.
Discussion 0