quollr: An R Package for Visualizing 2-D Models from Nonlinear Dimension Reductions in High-Dimensional Space
Publication
Metrics
Paper Preview
Abstract
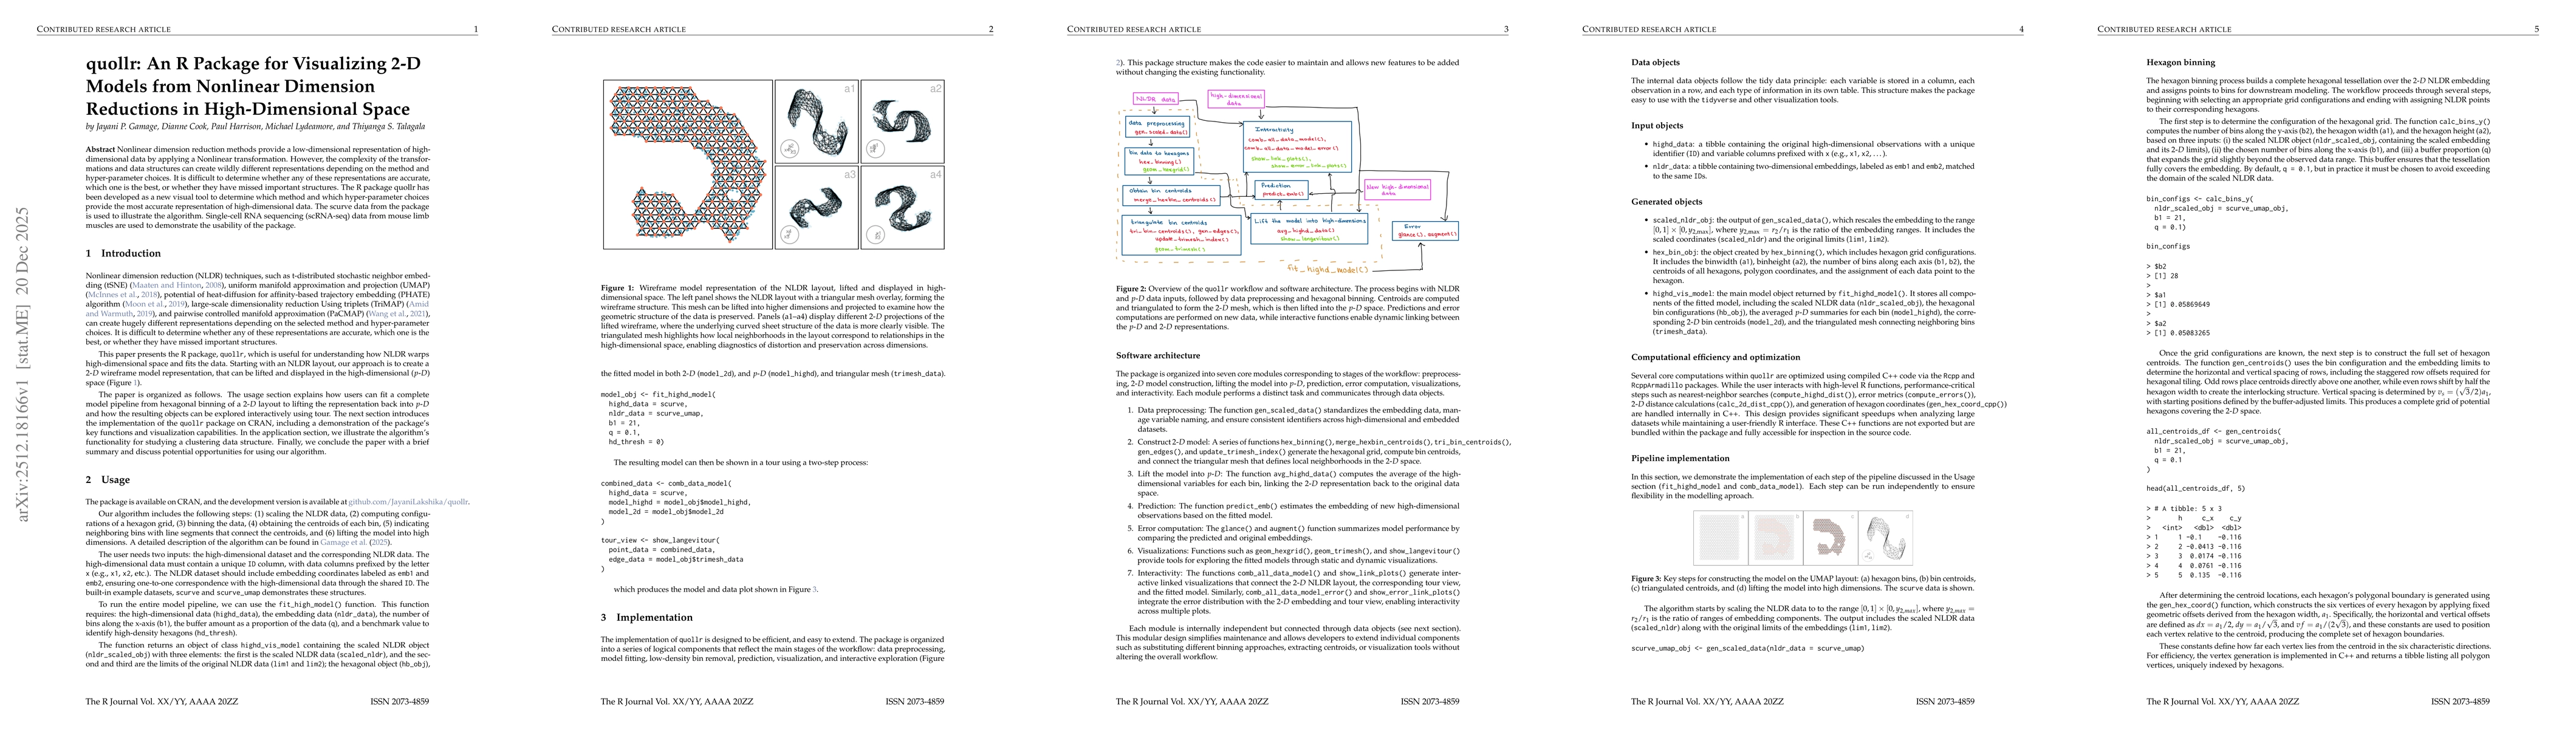
Nonlinear dimension reduction methods provide a low-dimensional representation of high-dimensional data by applying a Nonlinear transformation. However, the complexity of the transformations and data structures can create wildly different representations depending on the method and hyper-parameter choices. It is difficult to determine whether any of these representations are accurate, which one is the best, or whether they have missed important structures. The R package quollr has been developed as a new visual tool to determine which method and which hyper-parameter choices provide the most accurate representation of high-dimensional data. The scurve data from the package is used to illustrate the algorithm. Single-cell RNA sequencing (scRNA-seq) data from mouse limb muscles are used to demonstrate the usability of the package.
AI Key Findings
Get AI-generated insights about this paper's methodology, results, significance, and more — seven facets brought into focus.
Discussion 0