Publication
Metrics
AI Quick Summary
This paper proposes an image-space colorization method to enhance the interpretability of line-based density plots by employing color to highlight similar regions and trends. The method uses hierarchical clustering and circular MDS for color mapping, and a heuristic approach for line clustering, validated through a user study and real-world datasets.
Paper Preview
Abstract
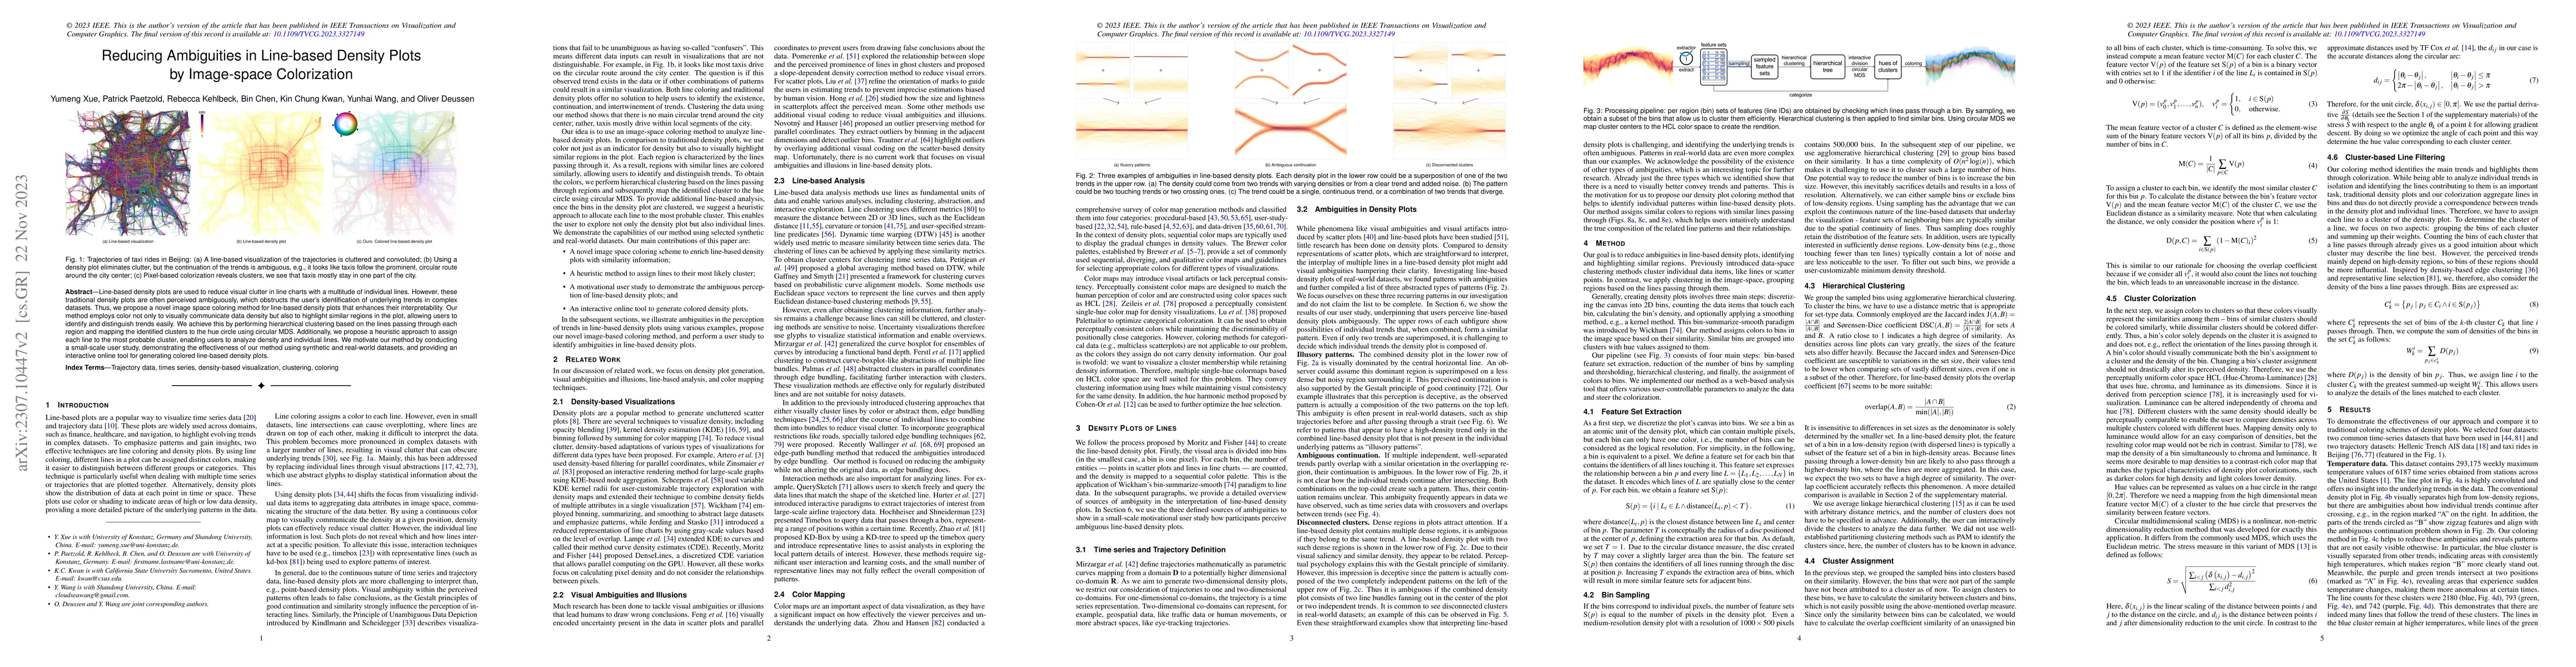
Line-based density plots are used to reduce visual clutter in line charts with a multitude of individual lines. However, these traditional density plots are often perceived ambiguously, which obstructs the user's identification of underlying trends in complex datasets. Thus, we propose a novel image space coloring method for line-based density plots that enhances their interpretability. Our method employs color not only to visually communicate data density but also to highlight similar regions in the plot, allowing users to identify and distinguish trends easily. We achieve this by performing hierarchical clustering based on the lines passing through each region and mapping the identified clusters to the hue circle using circular MDS. Additionally, we propose a heuristic approach to assign each line to the most probable cluster, enabling users to analyze density and individual lines. We motivate our method by conducting a small-scale user study, demonstrating the effectiveness of our method using synthetic and real-world datasets, and providing an interactive online tool for generating colored line-based density plots.
AI Key Findings
Get AI-generated insights about this paper's methodology, results, significance, and more — seven facets brought into focus.
Impact
Paper Details
Authors
PDF Preview
Key Terms
Citation Network
Current paper (gray), citations (green), references (blue)
Display is limited for performance on very large graphs.
Discussion 0