Publication
Metrics
Paper Preview
Abstract
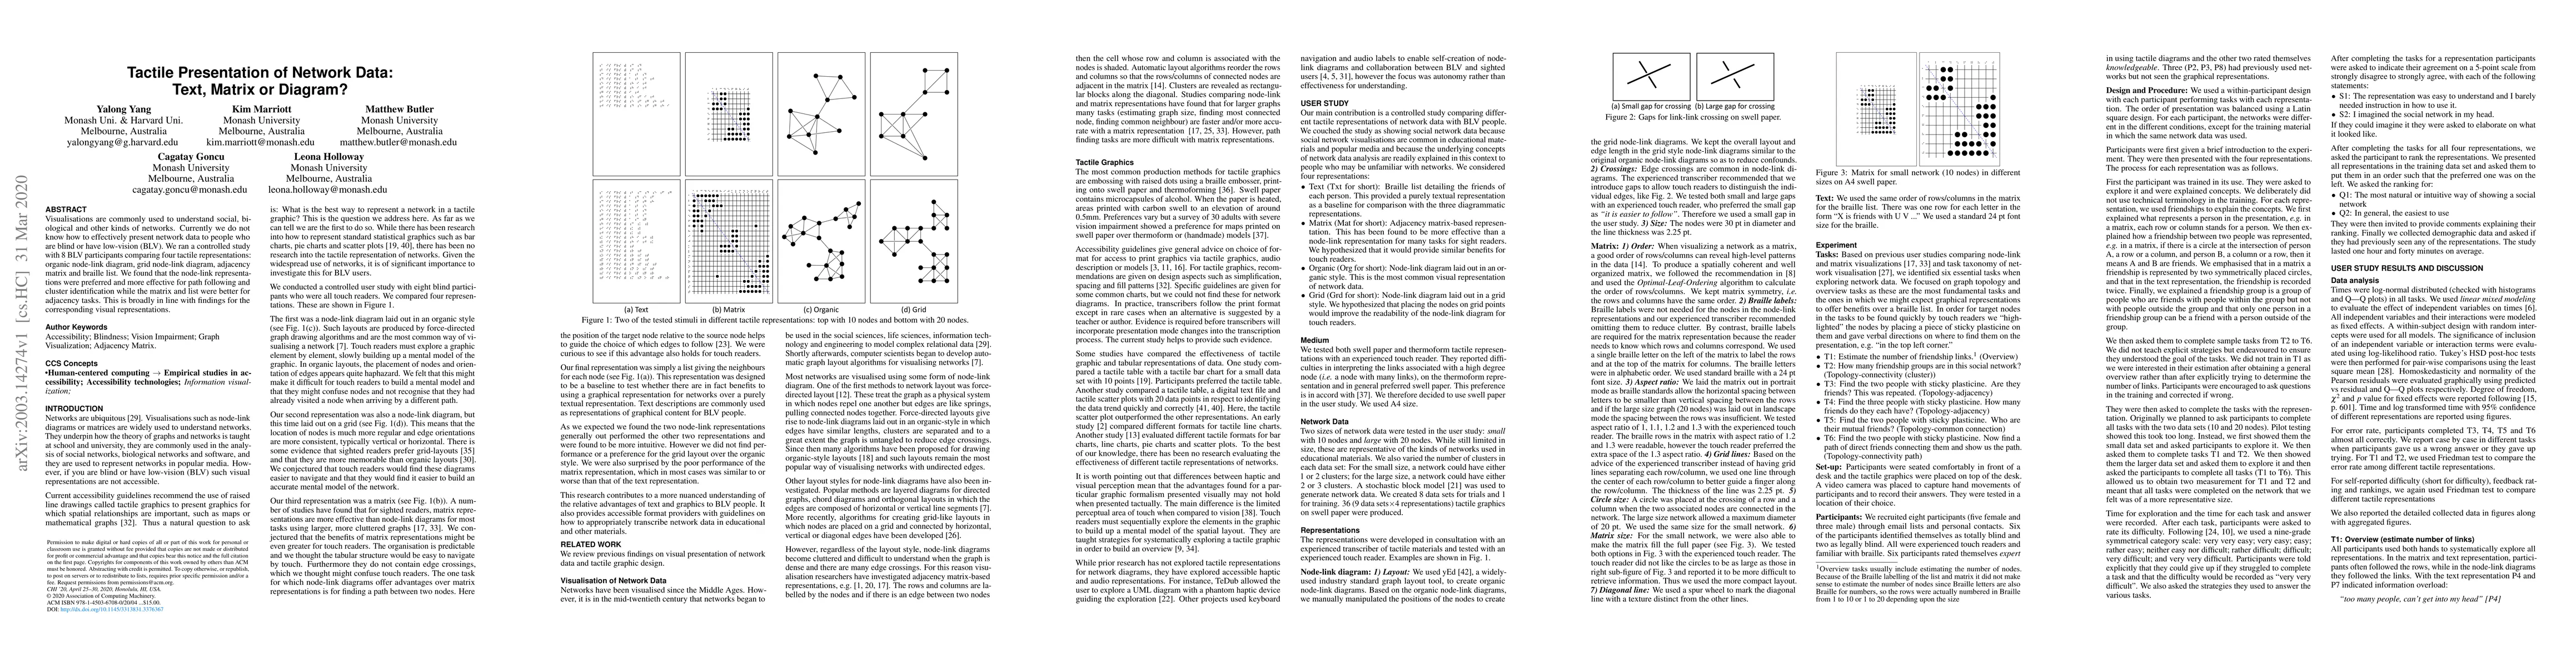
Visualisations are commonly used to understand social, biological and other kinds of networks. Currently, we do not know how to effectively present network data to people who are blind or have low-vision (BLV). We ran a controlled study with 8 BLV participants comparing four tactile representations: organic node-link diagram, grid node-link diagram, adjacency matrix and braille list. We found that the node-link representations were preferred and more effective for path following and cluster identification while the matrix and list were better for adjacency tasks. This is broadly in line with findings for the corresponding visual representations.
AI Key Findings
Get AI-generated insights about this paper's methodology, results, significance, and more — seven facets brought into focus.
Impact
Paper Details
Authors
PDF Preview
Key Terms
Citation Network
Current paper (gray), citations (green), references (blue)
Display is limited for performance on very large graphs.
Discussion 0