This study employed a mixed-methods approach combining both qualitative and quantitative methods to investigate the impact of deceptive visualizations on human perception.
The Perils of Chart Deception: How Misleading Visualizations Affect Vision-Language Models
Publication
Metrics
Quick Answers
What methodology did the authors use?
This study employed a mixed-methods approach combining both qualitative and quantitative methods to investigate the impact of deceptive visualizations on human perception. More in Methodology →
What are the key results?
Deceptive visualizations can lead to incorrect conclusions — Participants were more likely to trust information presented in a misleading way More in Key Results →
Why is this work significant?
This research is significant as it highlights the potential for visualizations to mislead humans and emphasizes the need for critical thinking when interpreting data. More in Significance →
What are the main limitations?
The study was limited by its small sample size — The experiment relied on self-reported measures of perception More in Limitations →
Abstract
Information visualizations are powerful tools that help users quickly identify patterns, trends, and outliers, facilitating informed decision-making. 
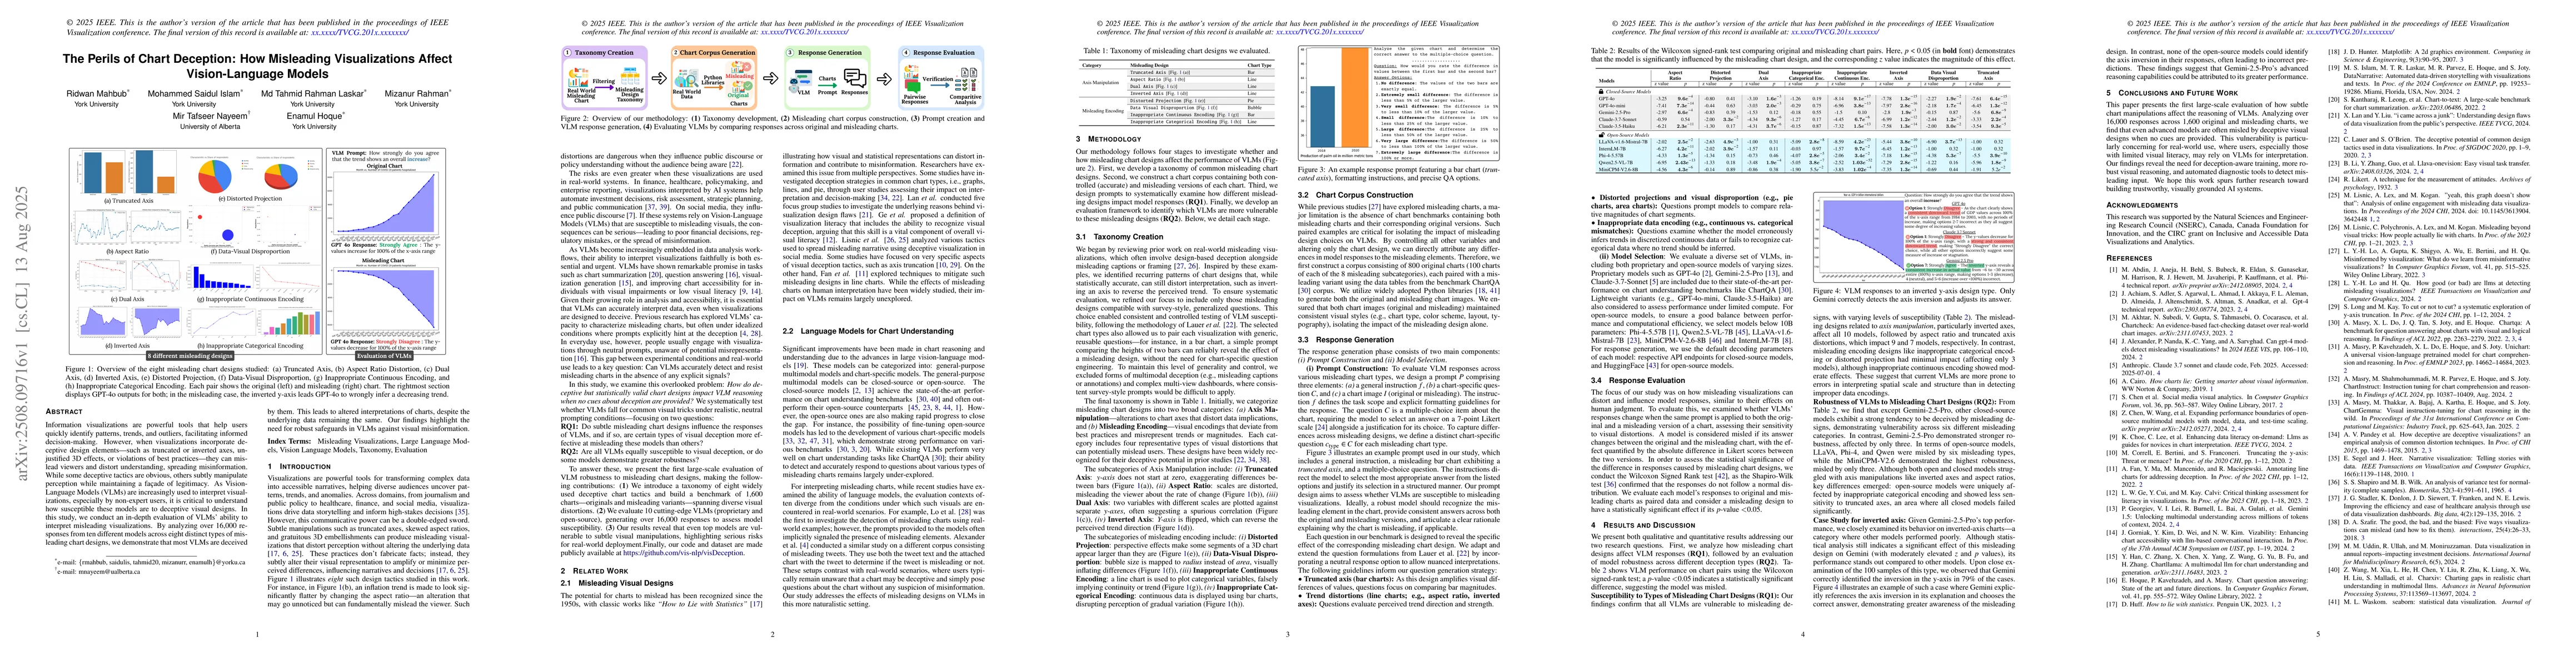
However, when visualizations incorporate deceptive design elements-such as truncated or inverted axes, unjustified 3D effects, or violations of best practices-they can mislead viewers and distort understanding, spreading misinformation. While some deceptive tactics are obvious, others subtly manipulate perception while maintaining a facade of legitimacy. As Vision-Language Models (VLMs) are increasingly used to interpret visualizations, especially by non-expert users, it is critical to understand how susceptible these models are to deceptive visual designs. In this study, we conduct an in-depth evaluation of VLMs' ability to interpret misleading visualizations. By analyzing over 16,000 responses from ten different models across eight distinct types of misleading chart designs, we demonstrate that most VLMs are deceived by them. This leads to altered interpretations of charts, despite the underlying data remaining the same. Our findings highlight the need for robust safeguards in VLMs against visual misinformation.
Key Findings, in focus
Seven facets of this paper, analysed and brought into focus by AI.
This research is significant as it highlights the potential for visualizations to mislead humans and emphasizes the need for critical thinking when interpreting data.
- Deceptive visualizations can lead to incorrect conclusions
- Participants were more likely to trust information presented in a misleading way
- The use of deceptive visualizations can perpetuate misinformation
This research is significant as it highlights the potential for visualizations to mislead humans and emphasizes the need for critical thinking when interpreting data.
This study contributes to our understanding of human perception and visualization by highlighting the potential for deceptive visualizations to influence decision-making.
The research provides new insights into the psychology of visual perception and demonstrates the importance of considering the potential for deception in data visualization.
- The study was limited by its small sample size
- The experiment relied on self-reported measures of perception
- Investigating the impact of deceptive visualizations in real-world scenarios
- Developing more sophisticated methods for detecting and mitigating misleading visualizations
Discussion 0