AI Quick Summary
VisGrader automates the grading of D3 visualizations, evaluating data bindings, visual encodings, interactions, and design specifications to provide scalable and precise feedback. This method has been successfully deployed in a Georgia Tech course, benefiting over 4000 students by enabling frequent submissions and rapid feedback.
Paper Preview
Abstract
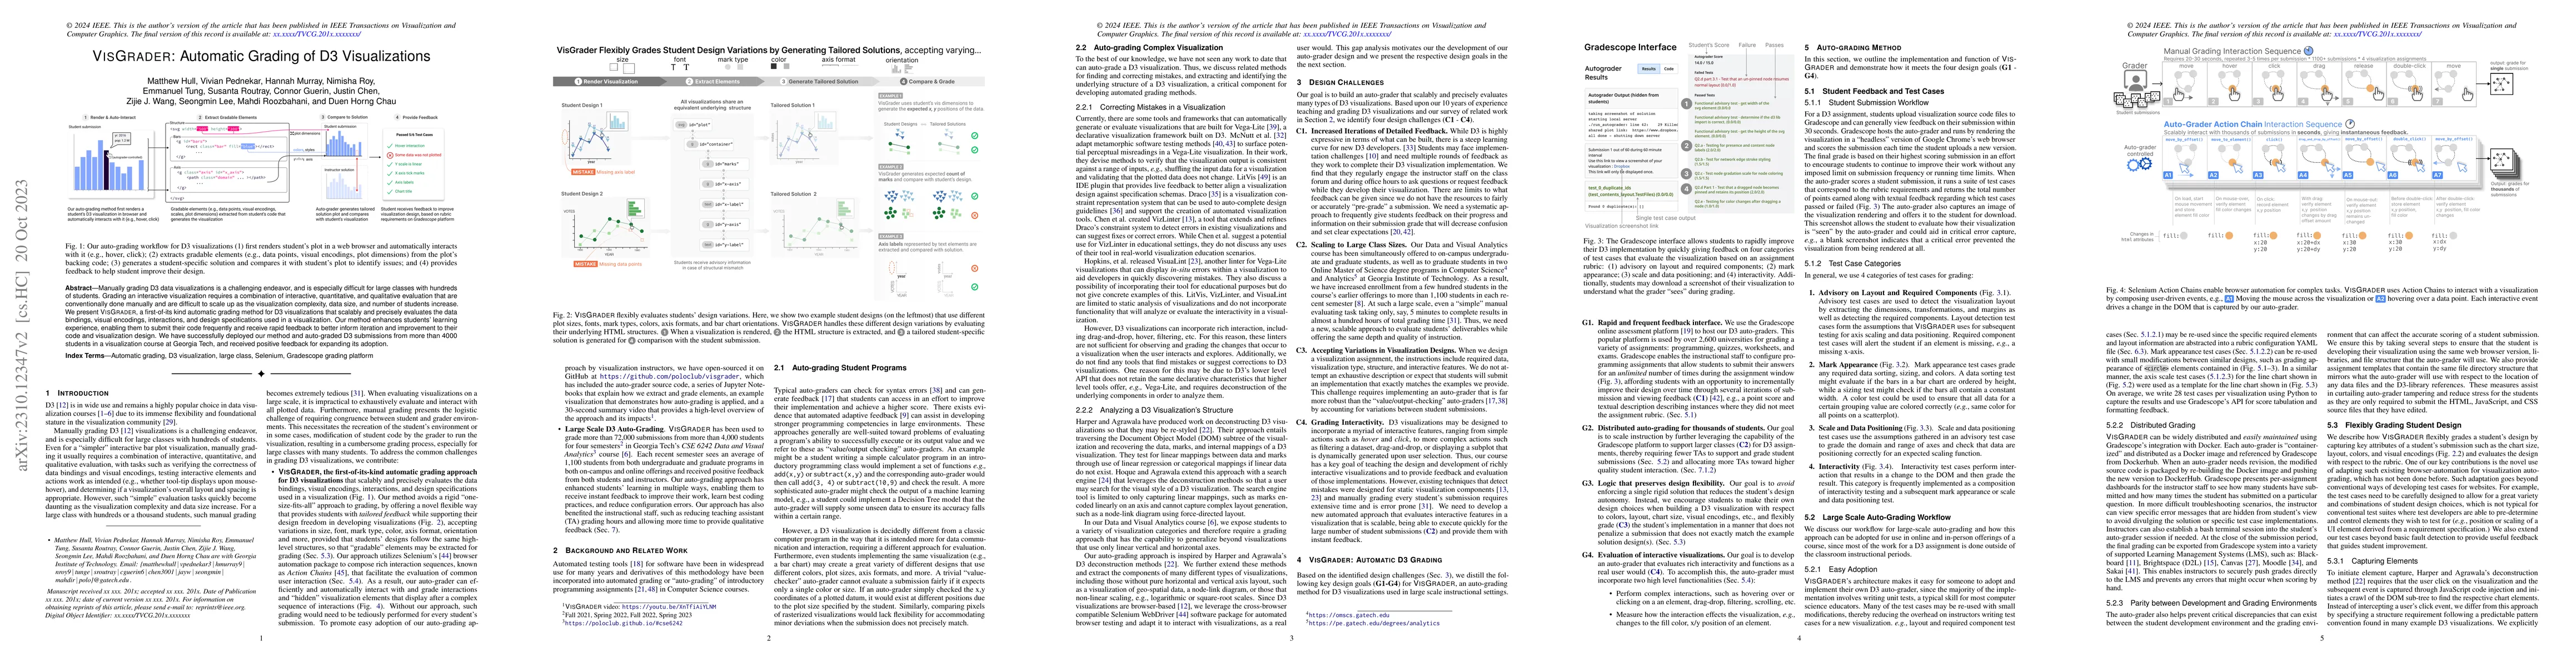
Manually grading D3 data visualizations is a challenging endeavor, and is especially difficult for large classes with hundreds of students. Grading an interactive visualization requires a combination of interactive, quantitative, and qualitative evaluation that are conventionally done manually and are difficult to scale up as the visualization complexity, data size, and number of students increase. We present VisGrader, a first-of-its kind automatic grading method for D3 visualizations that scalably and precisely evaluates the data bindings, visual encodings, interactions, and design specifications used in a visualization. Our method enhances students learning experience, enabling them to submit their code frequently and receive rapid feedback to better inform iteration and improvement to their code and visualization design. We have successfully deployed our method and auto-graded D3 submissions from more than 4000 students in a visualization course at Georgia Tech, and received positive feedback for expanding its adoption.
AI Key Findings
Get AI-generated insights about this paper's methodology, results, and significance.
Paper Details
How to Cite This Paper
@article{guerin2023visgrader,
  title         = {VisGrader: Automatic Grading of D3 Visualizations},
  author        = {Guerin, Connor and Chau, Duen Horng and Tung, Emmanuel and others},
  year          = {2023},
  eprint        = {2310.12347},
  archivePrefix = {arXiv},
  primaryClass  = {cs.HC},
}Guerin, C., Chau, D., Tung, E., Murray, H., Chen, J., Roozbahani, M., Hull, M., Roy, N., Lee, S., Routray, S., Pednekar, V., & Wang, Z. (2023). VisGrader: Automatic Grading of D3 Visualizations. arXiv. https://arxiv.org/abs/2310.12347Guerin, Connor, et al. "VisGrader: Automatic Grading of D3 Visualizations." arXiv, 2023, arxiv.org/abs/2310.12347.PDF Preview
Key Terms
Citation Network
Current paper (gray), citations (green), references (blue)
Display is limited for performance on very large graphs.
Similar Papers
Found 4 papersTowards Automatic Grading of D3.js Visualizations
Matthew Hull, Duen Horng Chau, Susanta Routray et al.
Searching the Visual Style and Structure of D3 Visualizations
Enamul Hoque, Maneesh Agrawala
Automatic Y-axis Rescaling in Dynamic Visualizations
Jacob Fisher, Eugene Wu, Remco Chang
VizExtract: Automatic Relation Extraction from Data Visualizations
Sanjay Krishnan, Dale Decatur
| Title | Authors | Year | Actions |
|---|
Comments (0)