Academic Profile
Statistics
Similar Authors
Papers on arXiv
Obstructive sleep apnea (OSA) is frequent and responsible for cardiovascular complications and excessive daytime sleepiness. It is underdiagnosed due to the difficulty to access the gold standard for ...
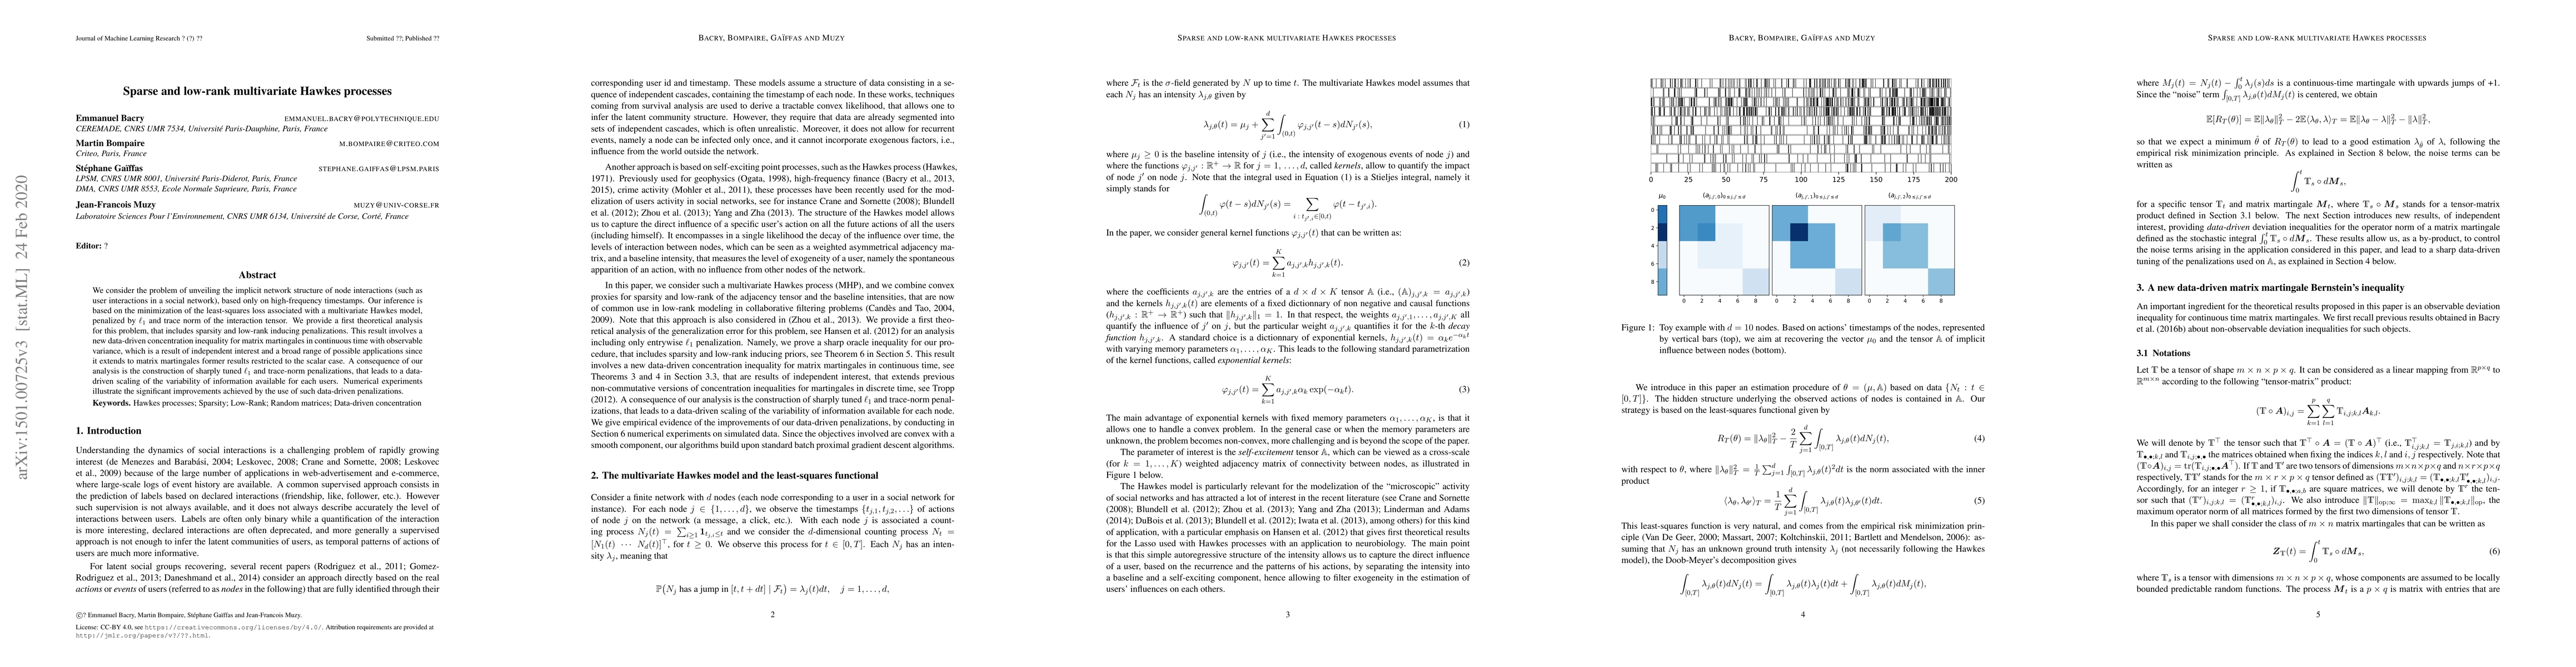
We consider the problem of unveiling the implicit network structure of node interactions (such as user interactions in a social network), based only on high-frequency timestamps. Our inference is ba...
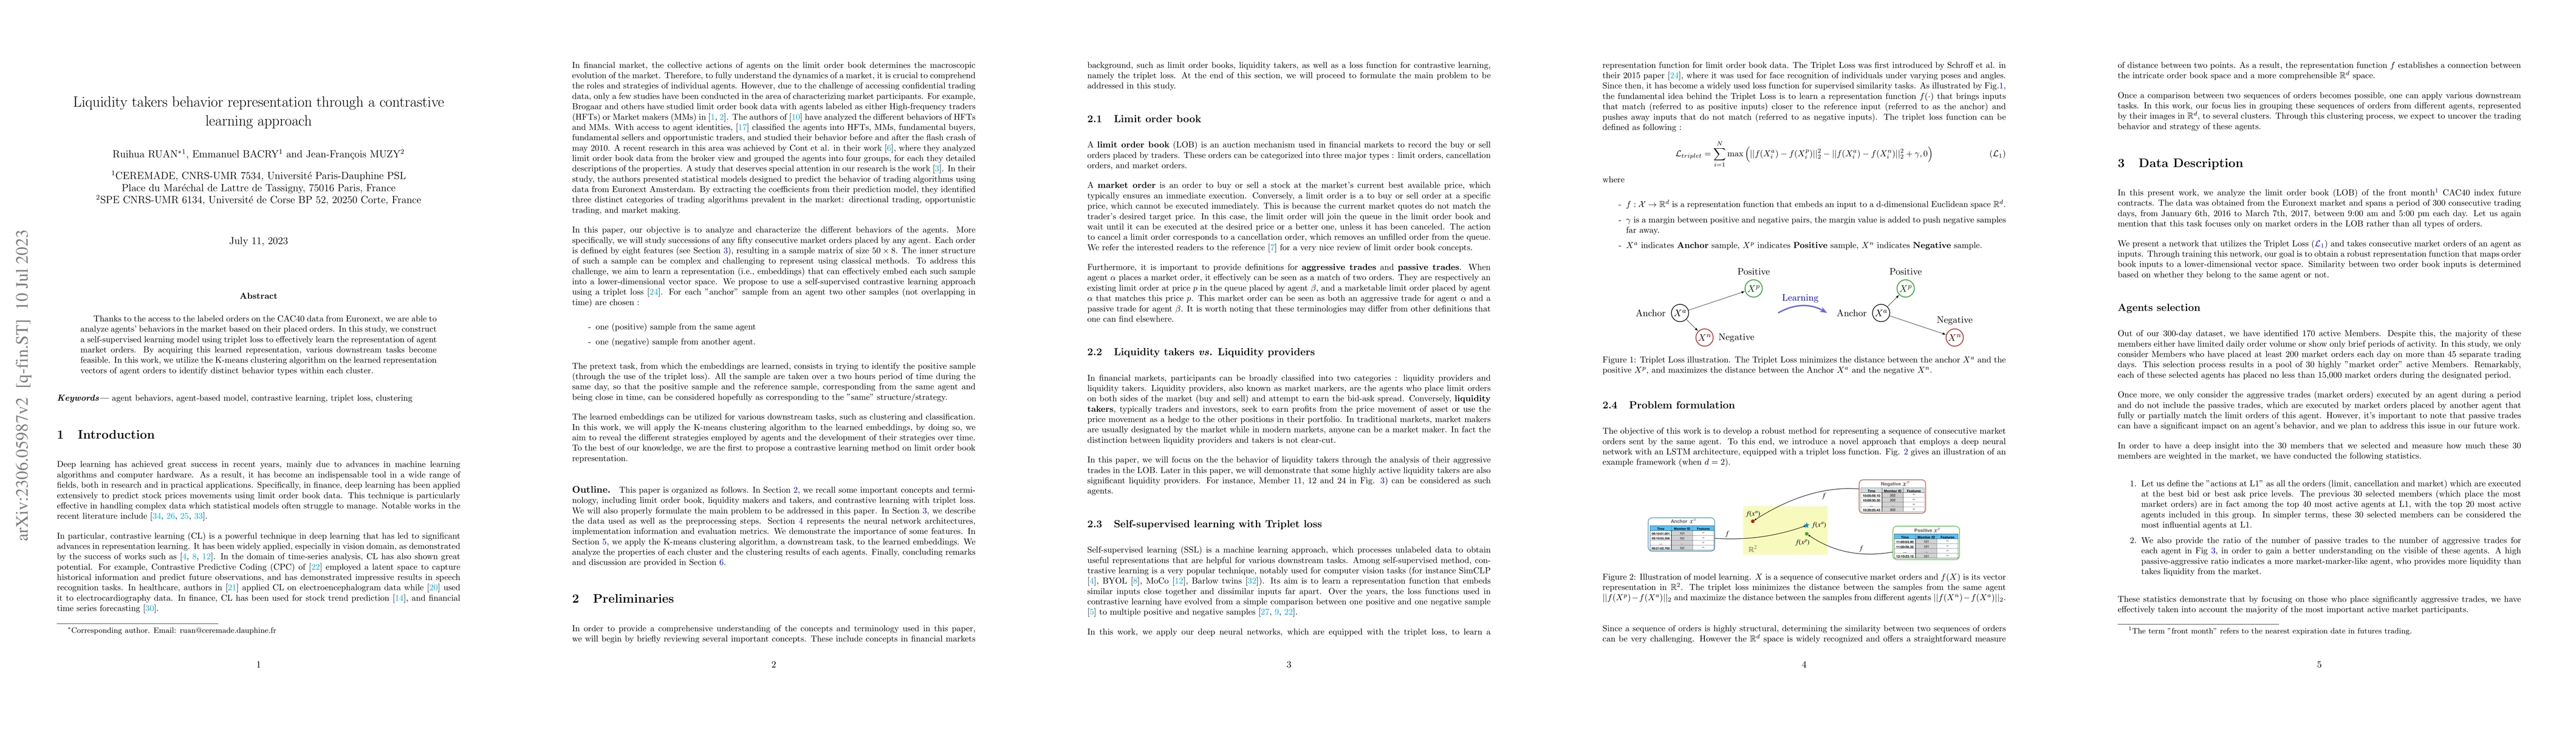
Thanks to the access to the labeled orders on the CAC40 data from Euronext, we are able to analyze agents' behaviors in the market based on their placed orders. In this study, we construct a self-su...
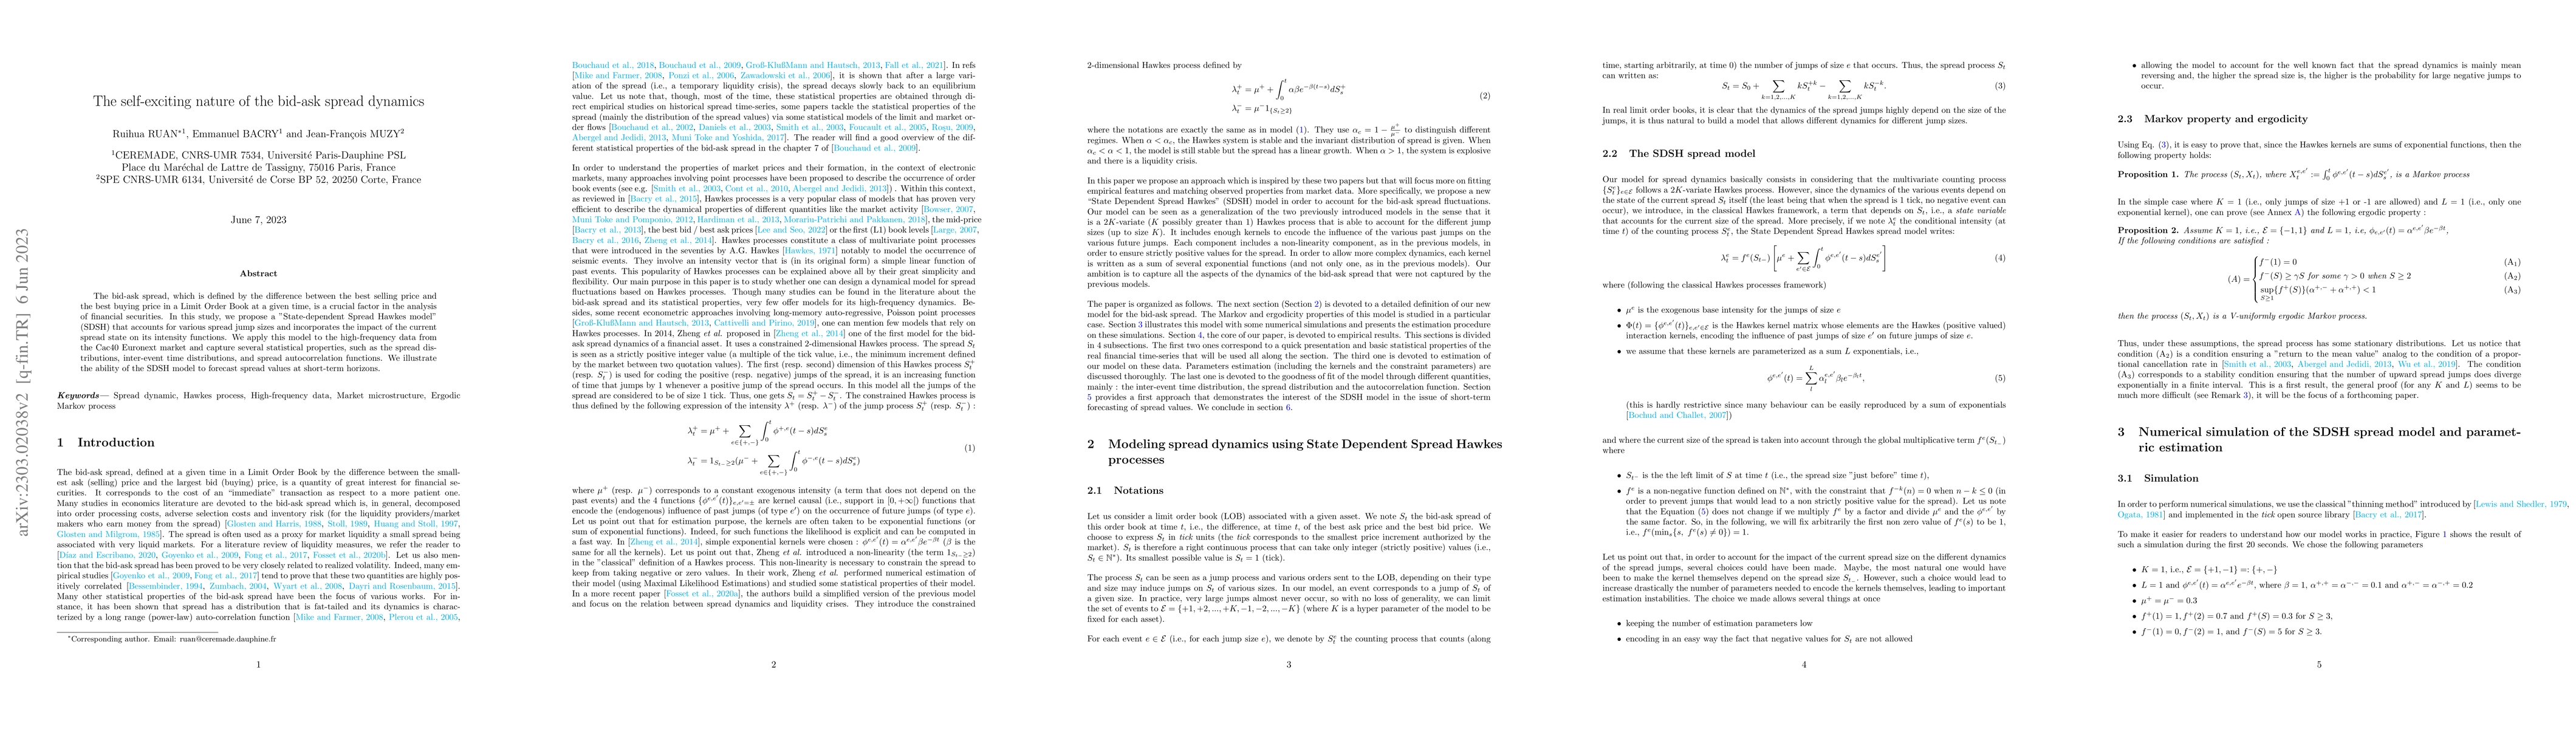
The bid-ask spread, which is defined by the difference between the best selling price and the best buying price in a Limit Order Book at a given time, is a crucial factor in the analysis of financia...
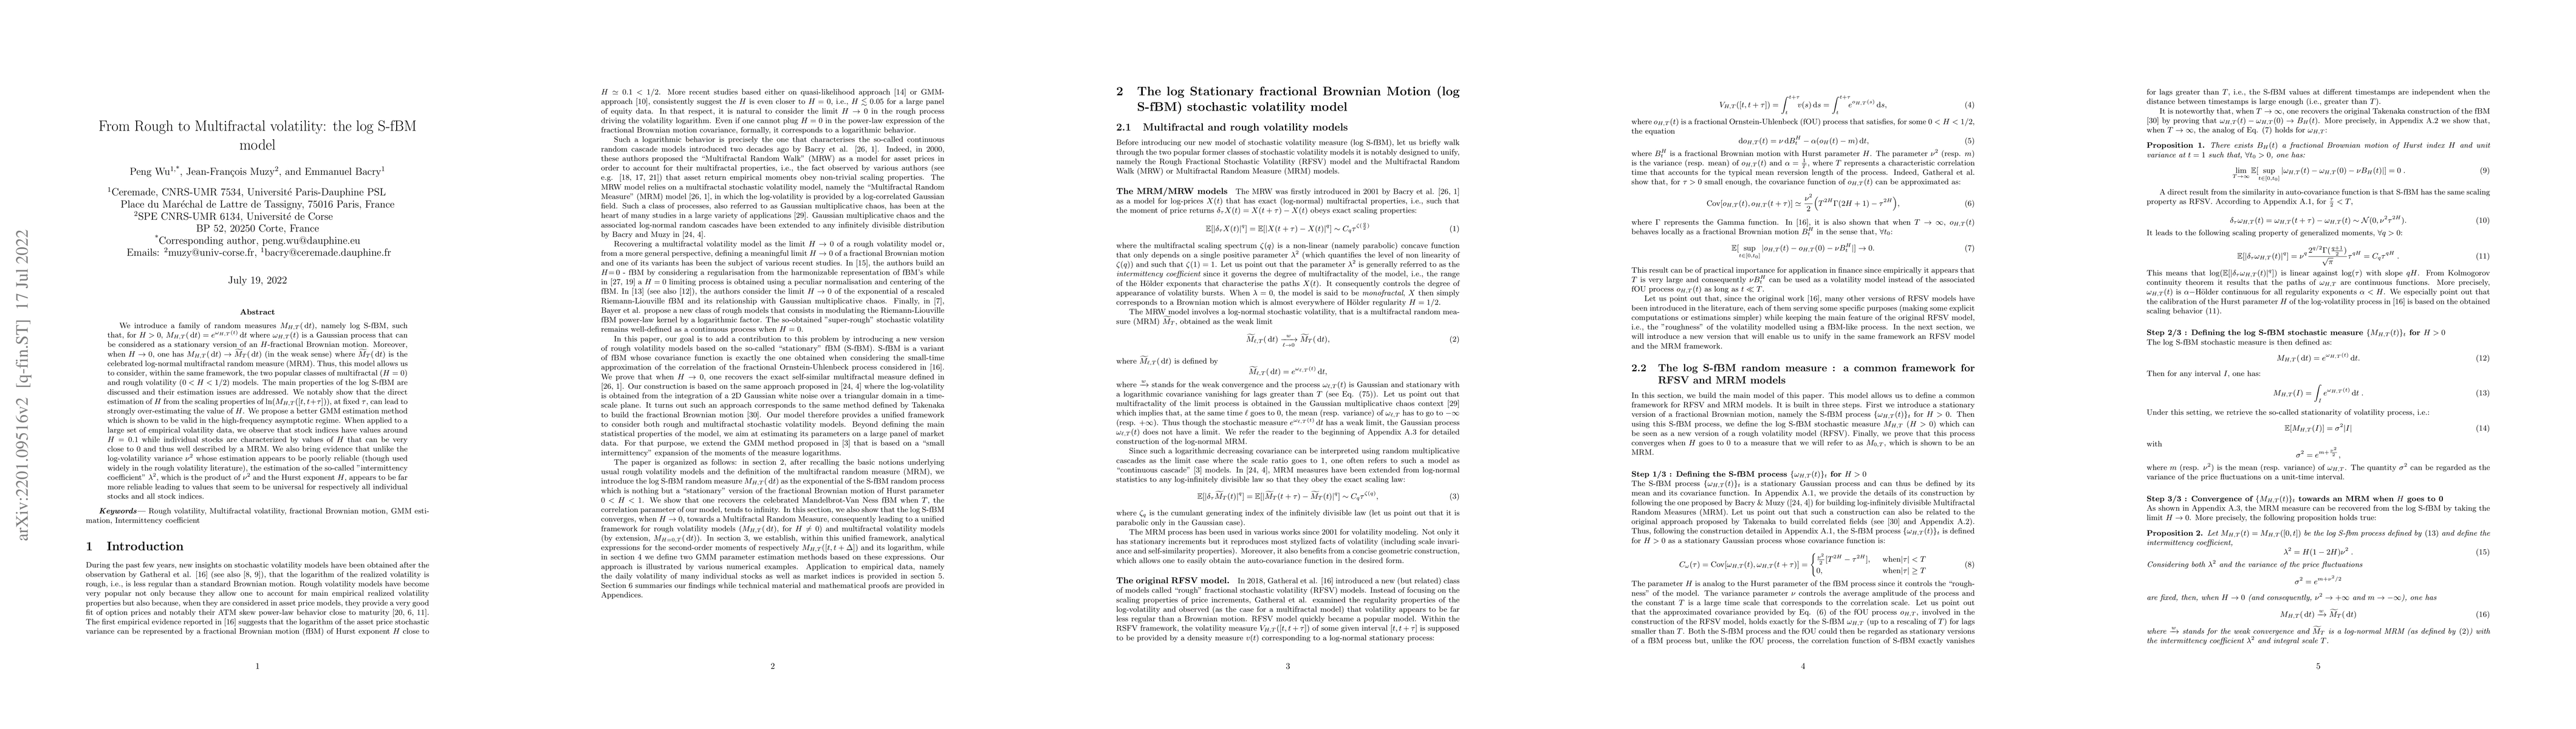
We introduce a family of random measures $M_{H,T} (d t)$, namely log S-fBM, such that, for $H>0$, $M_{H,T}(d t) = e^{\omega_{H,T}(t)} d t$ where $\omega_{H,T}(t)$ is a Gaussian process that can be c...
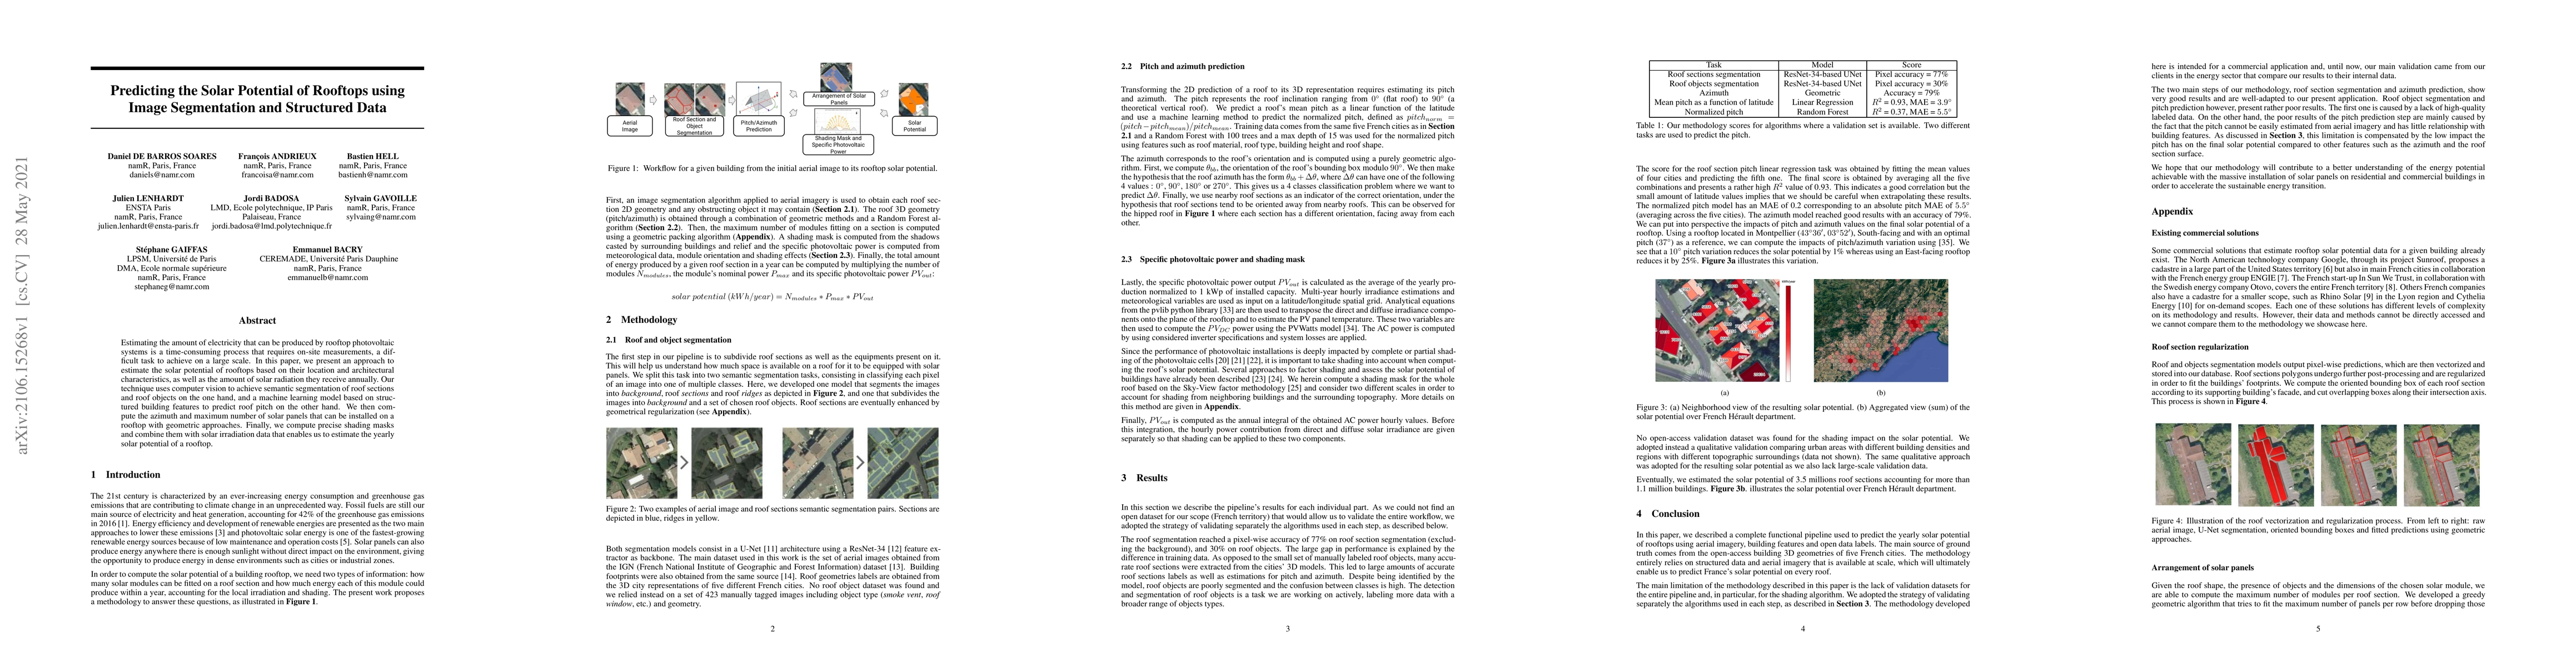
Estimating the amount of electricity that can be produced by rooftop photovoltaic systems is a time-consuming process that requires on-site measurements, a difficult task to achieve on a large scale...
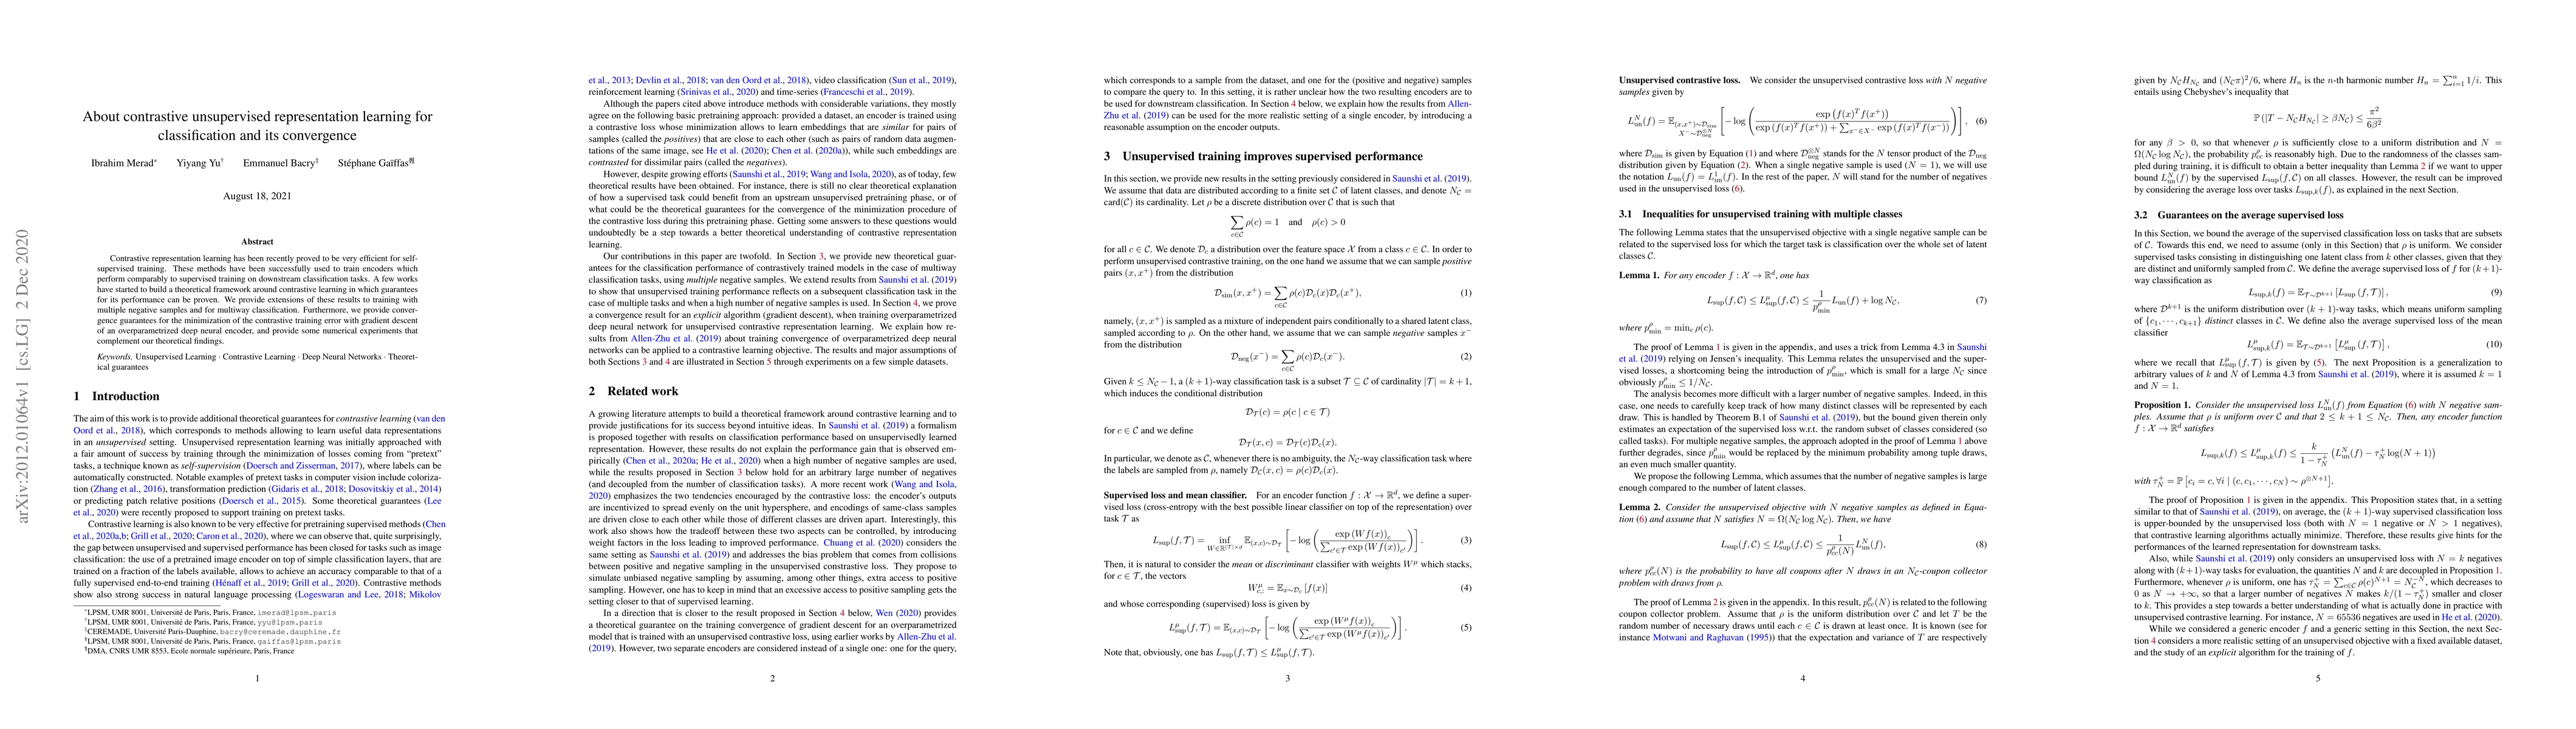
Contrastive representation learning has been recently proved to be very efficient for self-supervised training. These methods have been successfully used to train encoders which perform comparably t...
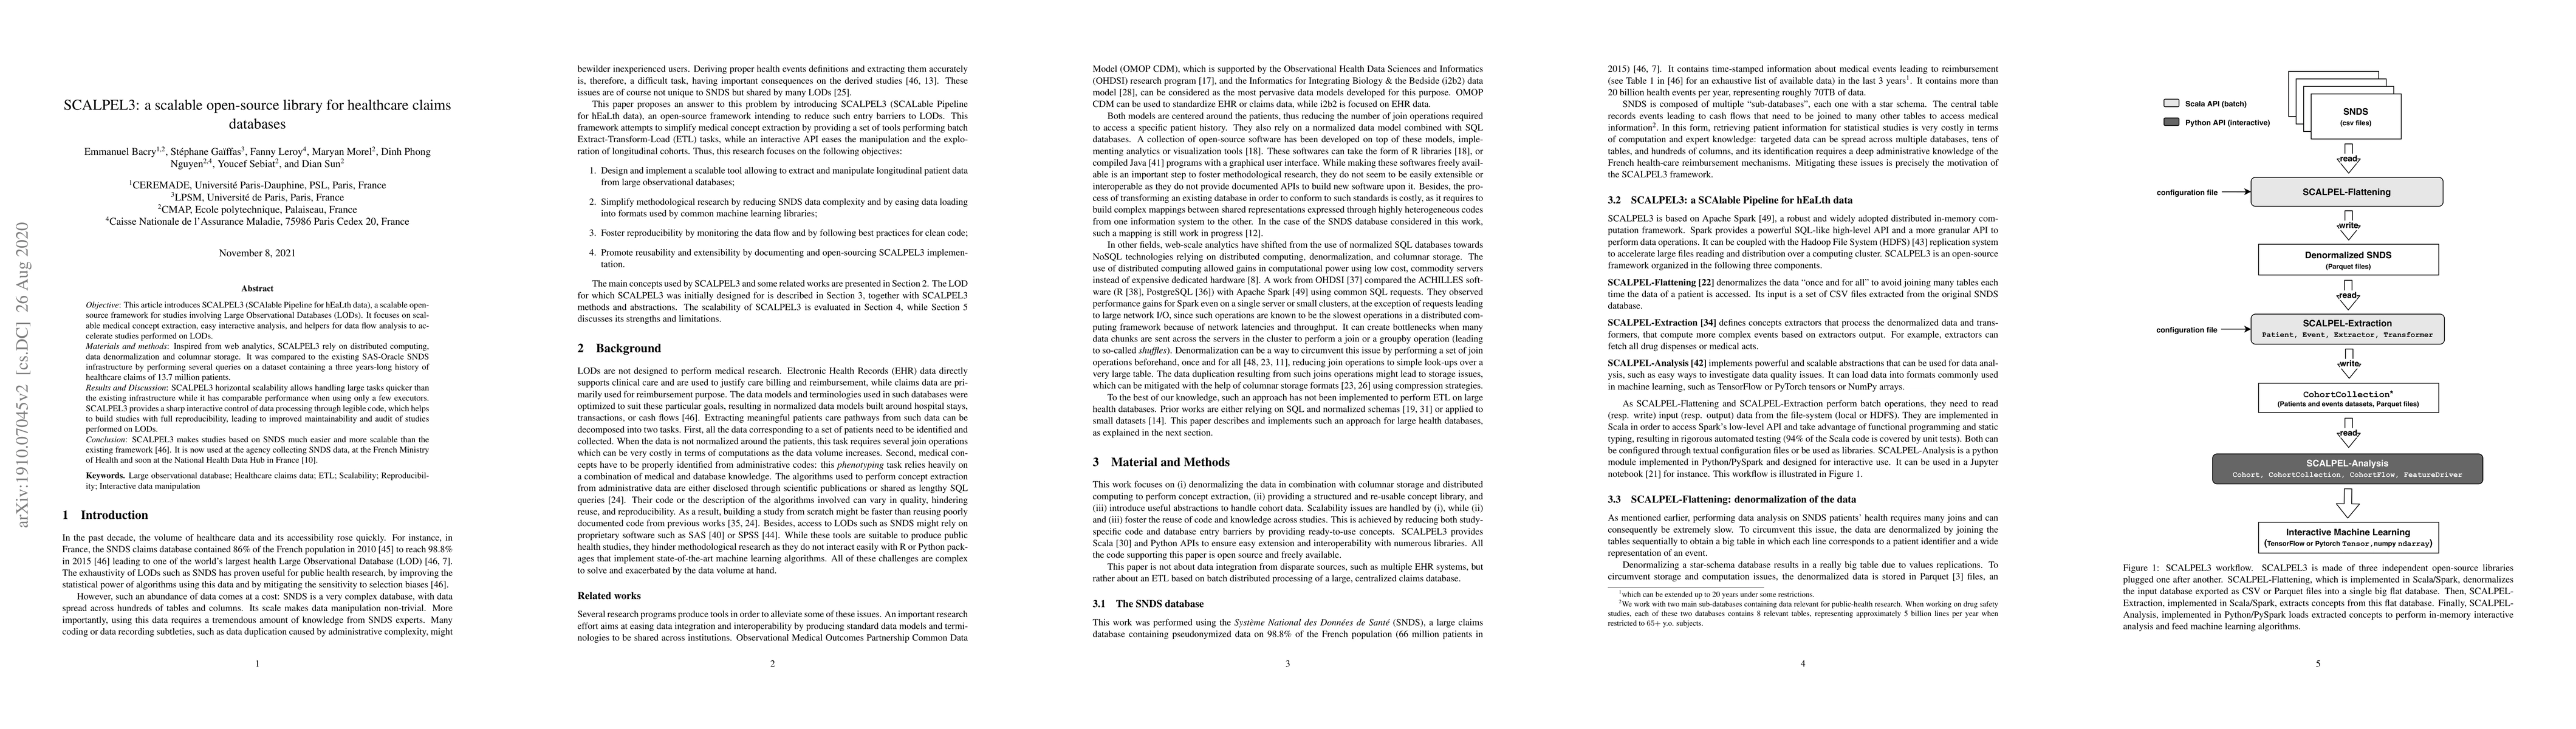
This article introduces SCALPEL3, a scalable open-source framework for studies involving Large Observational Databases (LODs). Its design eases medical observational studies thanks to abstractions a...
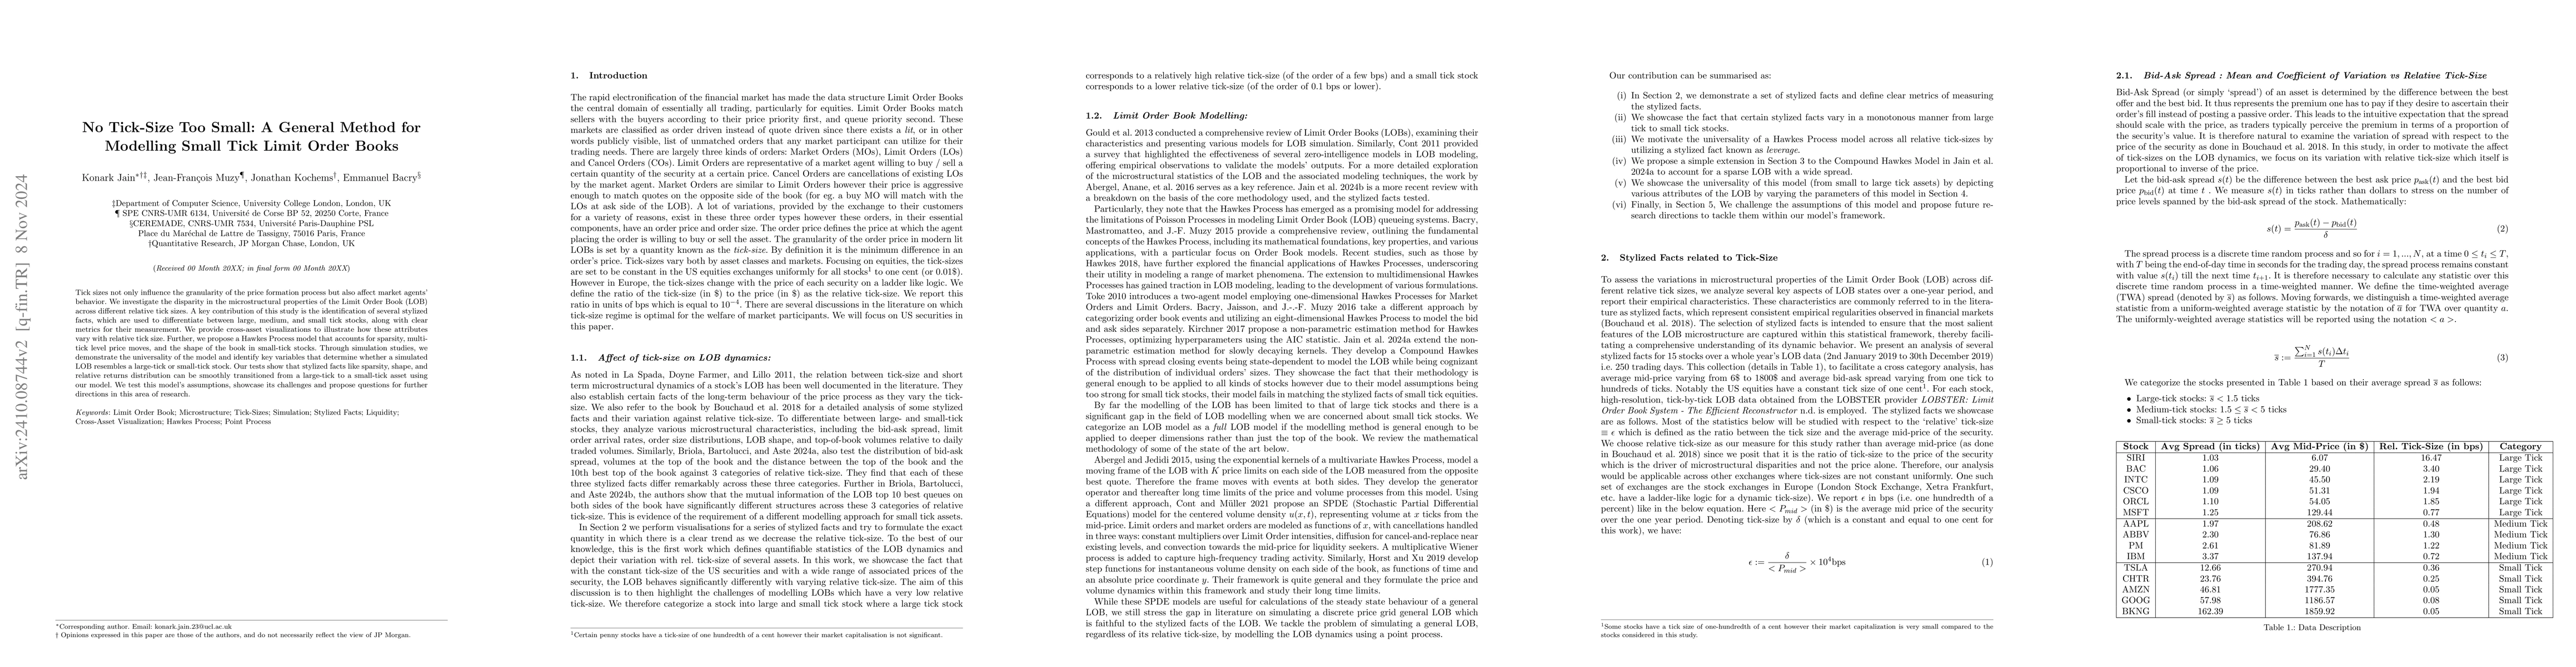
Tick sizes not only influence the granularity of the price formation process but also affect market agents' behavior. We investigate the disparity in the microstructural properties of the Limit Order ...
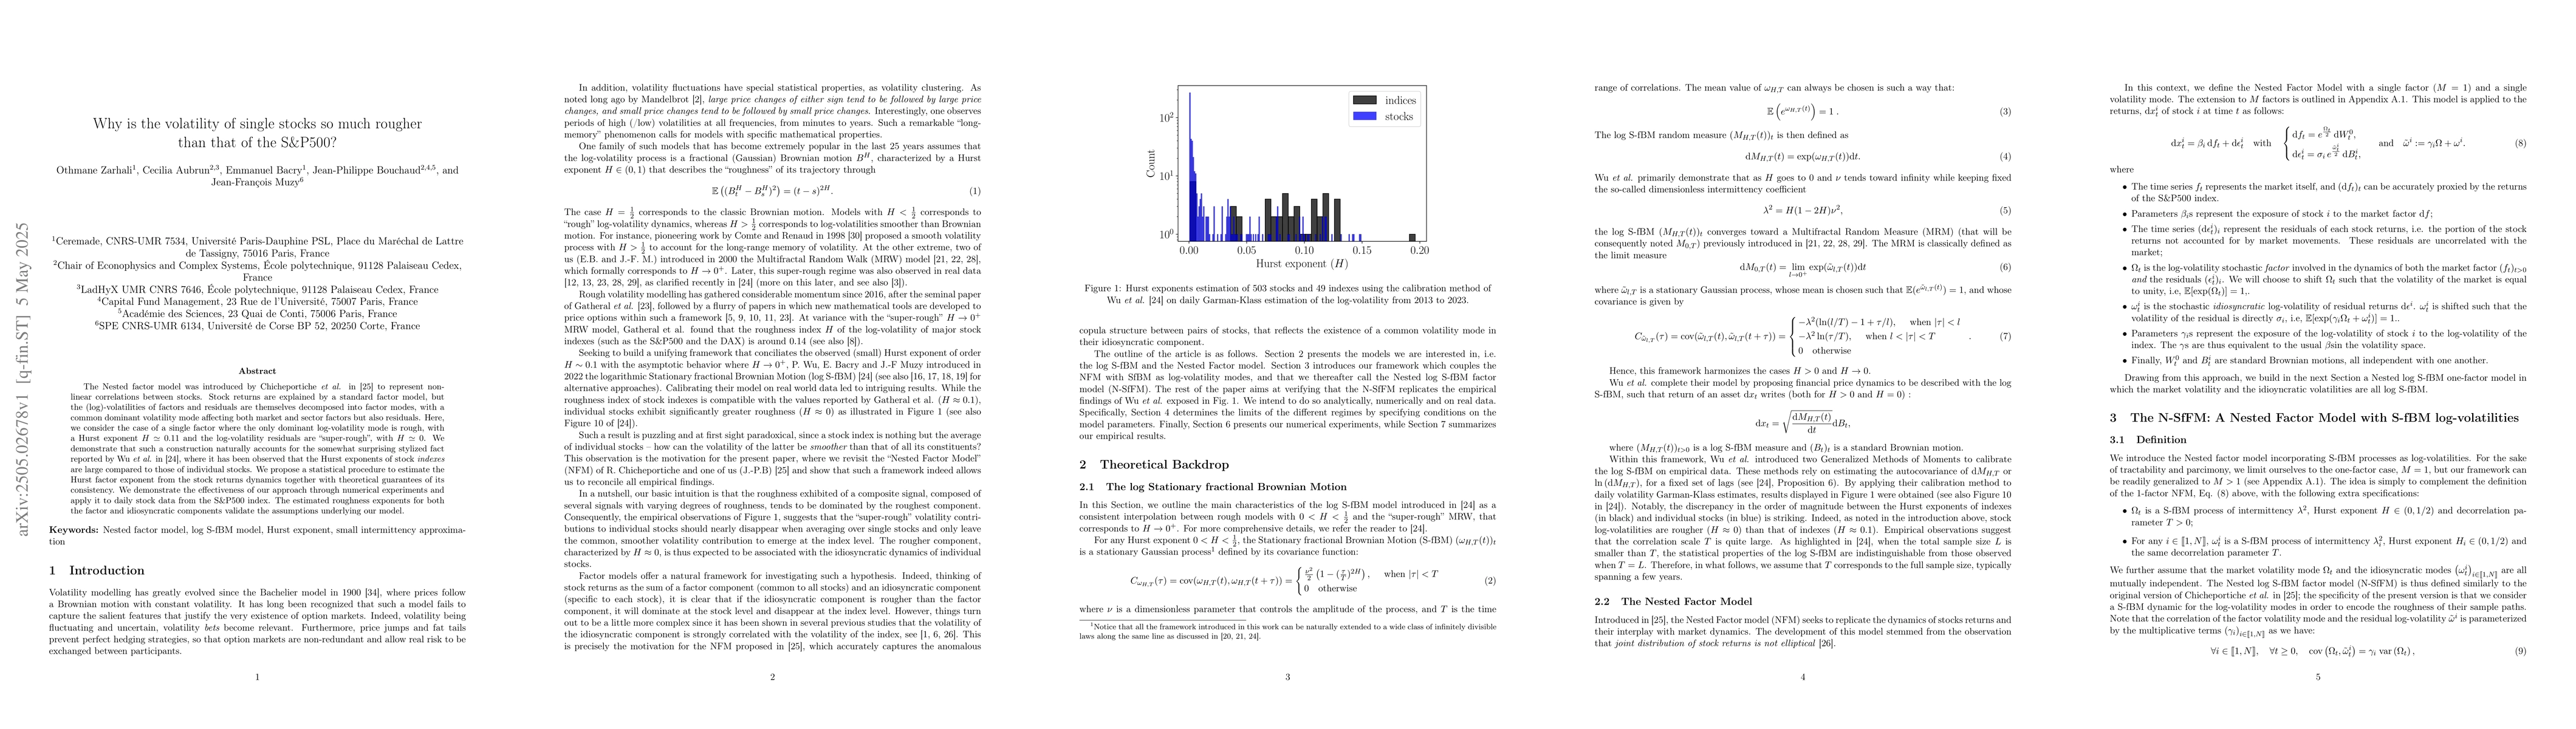
The Nested factor model was introduced by Chicheportiche et al. to represent non-linear correlations between stocks. Stock returns are explained by a standard factor model, but the (log)-volatilities ...
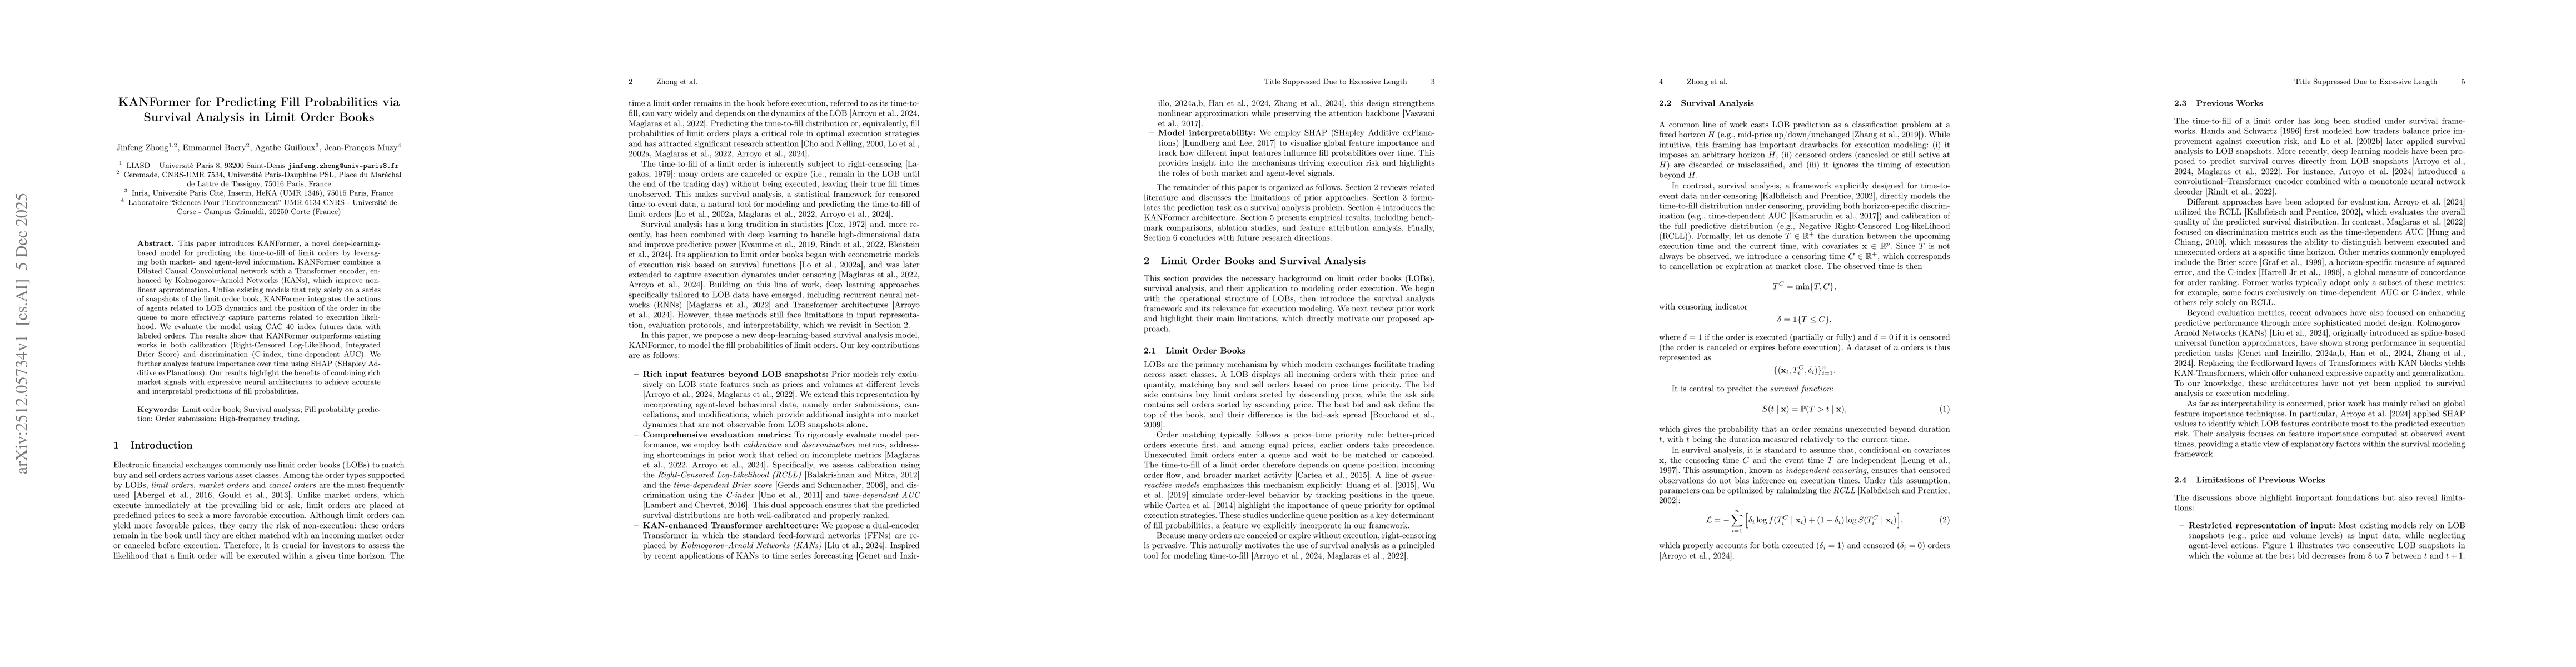
This paper introduces KANFormer, a novel deep-learning-based model for predicting the time-to-fill of limit orders by leveraging both market- and agent-level information. KANFormer combines a Dilated ...
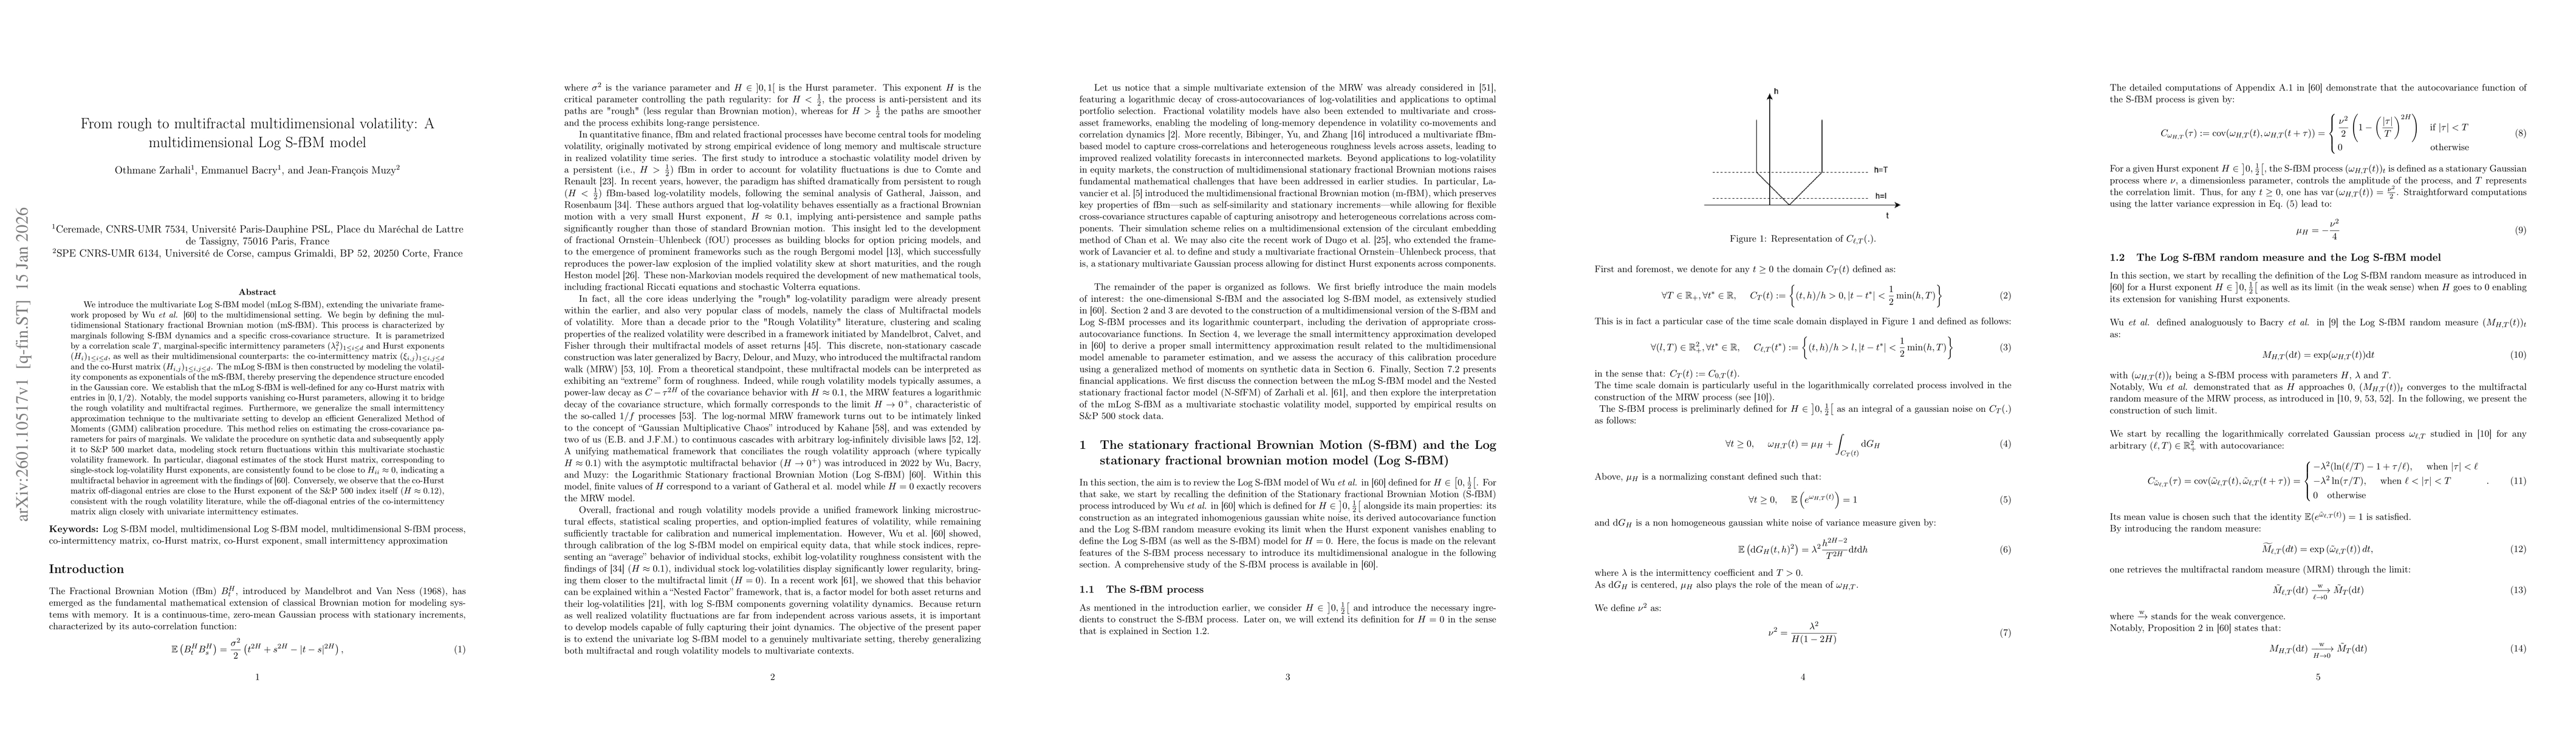
We introduce the multivariate Log S-fBM model (mLog S-fBM), extending the univariate framework proposed by Wu \textit{et al.} to the multidimensional setting. We define the multidimensional Stationary...
The development of clinical natural language processing (NLP) systems is severely hampered by the sensitive nature of medical records, which restricts data sharing under stringent privacy regulations,...