A Visual Analytics System for Profiling Urban Land Use Evolution
Publication
Metrics
AI Quick Summary
Urban Chronicles is an open-source visual analytics system designed to facilitate the interactive exploration of urban land use evolution, addressing the complexities of zoning data analysis. The system demonstrates its utility through case studies analyzing Hurricane Sandy's impact and proposed rezoning plans in Downtown Brooklyn using New York City's PLUTO data.
Paper Preview
Abstract
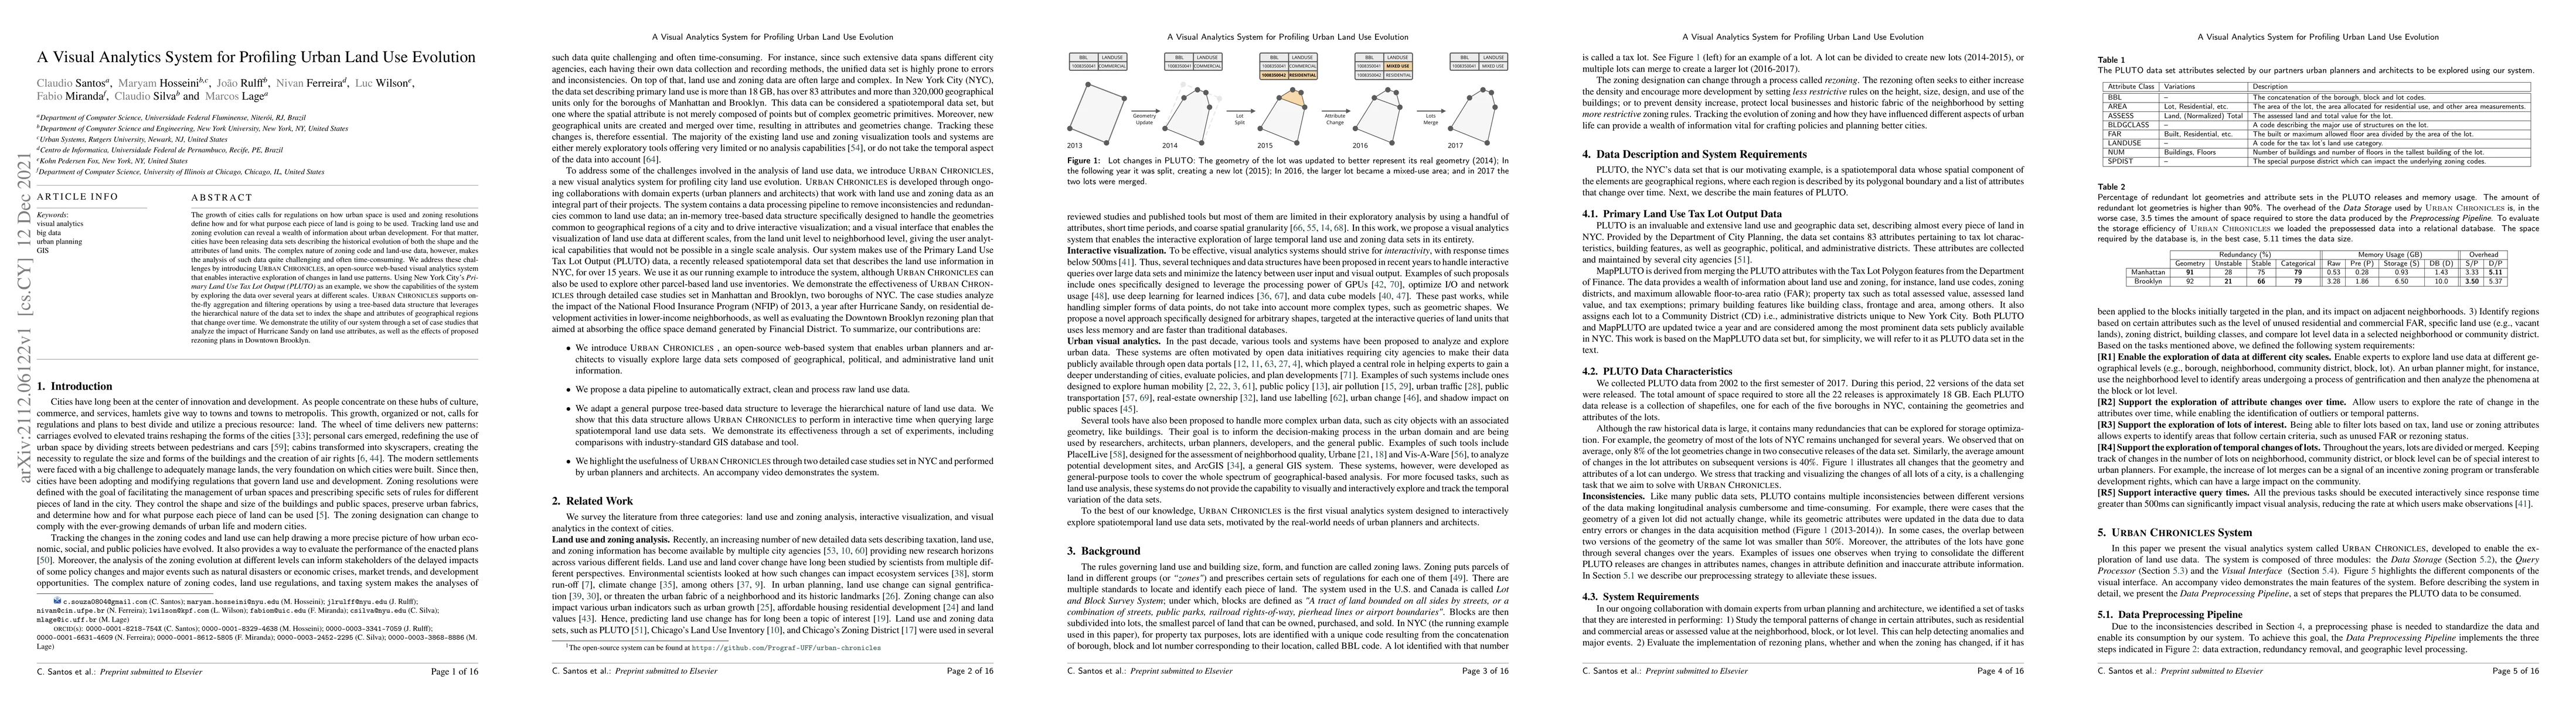
The growth of cities calls for regulations on how urban space is used and zoning resolutions define how and for what purpose each piece of land is going to be used. Tracking land use and zoning evolution can reveal a wealth of information about urban development. For that matter, cities have been releasing data sets describing the historical evolution of both the shape and the attributes of land units. The complex nature of zoning code and land-use data, however, makes the analysis of such data quite challenging and often time-consuming. We address these challenges by introducing Urban Chronicles, an open-source web-based visual analytics system that enables interactive exploration of changes in land use patterns. Using New York City's Primary Land Use Tax Lot Output (PLUTO) as an example, we show the capabilities of the system by exploring the data over several years at different scales. Urban Chronicles supports on-the-fly aggregation and filtering operations by using a tree-based data structure that leverages the hierarchical nature of the data set to index the shape and attributes of geographical regions that change over time. We demonstrate the utility of our system through a set of case studies that analyze the impact of Hurricane Sandy on land use attributes, as well as the effects of proposed rezoning plans in Downtown Brooklyn.
AI Key Findings
Get AI-generated insights about this paper's methodology, results, significance, and more — seven facets brought into focus.
Impact
Paper Details
Authors
PDF Preview
Key Terms
Citation Network
Current paper (gray), citations (green), references (blue)
Display is limited for performance on very large graphs.
Discussion 0